| Red | Green | Blue | |
| z | 17.64 | ||
| znorm | Inf | ||
| sky | -Inf | -Inf | -Inf |
| S/N | 28.5 | 49.0 | 54.4 |
| S/N(c) | 0.0 | 0.0 | 0.0 |
| SN(E/C) |
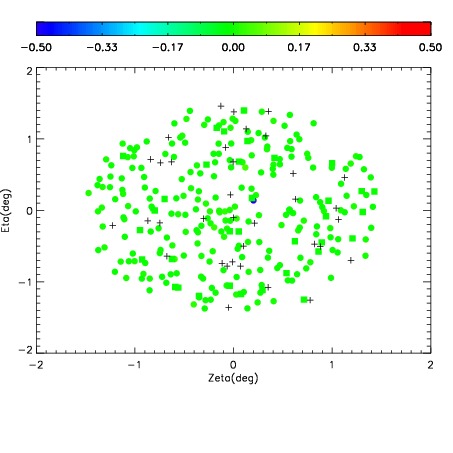

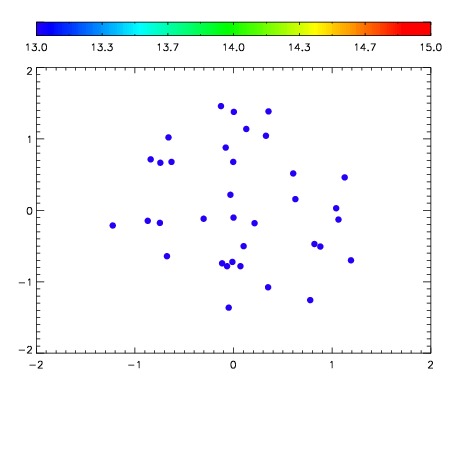

| Frame | Nreads | Zeropoints | Mag plots | Spatial mag deviation | Spatial sky 16325A emission deviations (filled: sky, open: star) | Spatial sky continuum emission | Spatial sky telluric CO2 absorption deviations (filled: H < 10) | |||||||||||||||||||||||
| 0 | 0 |
|
|
|
|
|
|
| IPAIR | NAME | SHIFT | NEWSHIFT | S/N | NAME | SHIFT | NEWSHIFT | S/N |
| 0 | 10210062 | 0.489930 | 0.00000 | 184.618 | 10210064 | -0.00206362 | 0.491994 | 182.573 |
| 1 | 10210063 | 0.489890 | 3.99947e-05 | 190.105 | 10210061 | 0.00000 | 0.489930 | 183.445 |
| 2 | 10210066 | 0.486819 | 0.00311100 | 181.099 | 10210065 | -0.00203732 | 0.491967 | 182.140 |
| 3 | 10210067 | 0.487343 | 0.00258699 | 177.882 | 10210068 | -0.00128766 | 0.491218 | 177.793 |