| Red | Green | Blue | |
| z | 17.64 | ||
| znorm | Inf | ||
| sky | -Inf | -Inf | -Inf |
| S/N | 26.9 | 48.3 | 51.3 |
| S/N(c) | 0.0 | 0.0 | 0.0 |
| SN(E/C) |
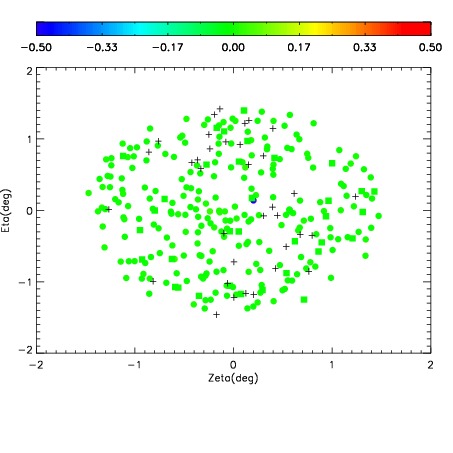
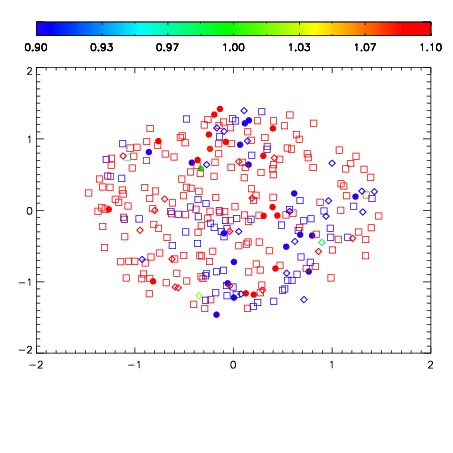
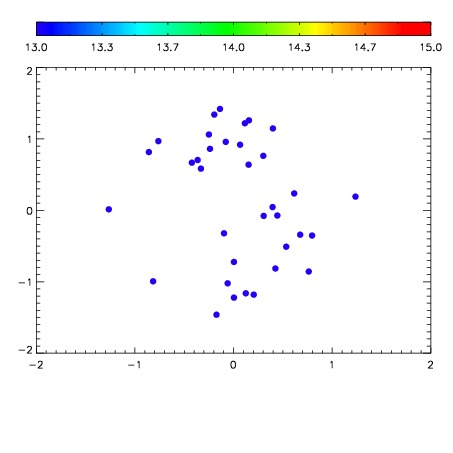

| Frame | Nreads | Zeropoints | Mag plots | Spatial mag deviation | Spatial sky 16325A emission deviations (filled: sky, open: star) | Spatial sky continuum emission | Spatial sky telluric CO2 absorption deviations (filled: H < 10) | |||||||||||||||||||||||
| 0 | 0 |
|
|
|
|
|
|
| IPAIR | NAME | SHIFT | NEWSHIFT | S/N | NAME | SHIFT | NEWSHIFT | S/N |
| 0 | 07230028 | 0.484159 | 0.00000 | 187.587 | 07230033 | 0.00620240 | 0.477957 | 190.187 |
| 1 | 07230027 | 0.483182 | 0.000976980 | 196.901 | 07230029 | 0.00593237 | 0.478227 | 198.710 |
| 2 | 07230032 | 0.483978 | 0.000180990 | 196.498 | 07230030 | 0.00393155 | 0.480227 | 198.200 |
| 3 | 07230031 | 0.483922 | 0.000236988 | 196.052 | 07230026 | 0.00000 | 0.484159 | 197.829 |