| Red | Green | Blue | |
| z | 17.64 | ||
| znorm | Inf | ||
| sky | -Inf | -NaN | -Inf |
| S/N | 24.3 | 45.2 | 47.8 |
| S/N(c) | 0.0 | 0.0 | 0.0 |
| SN(E/C) |
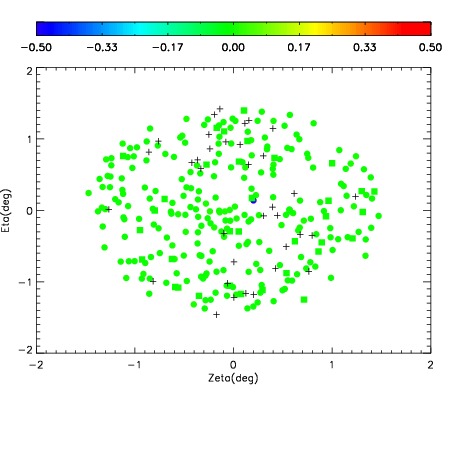
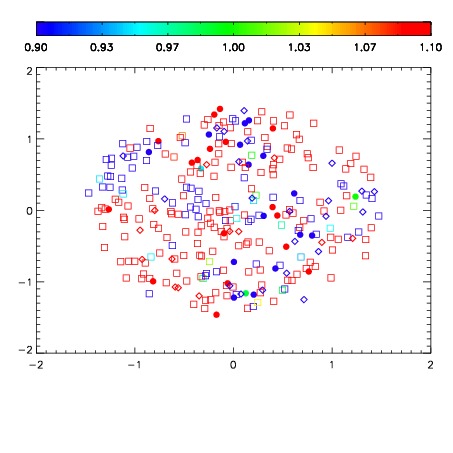
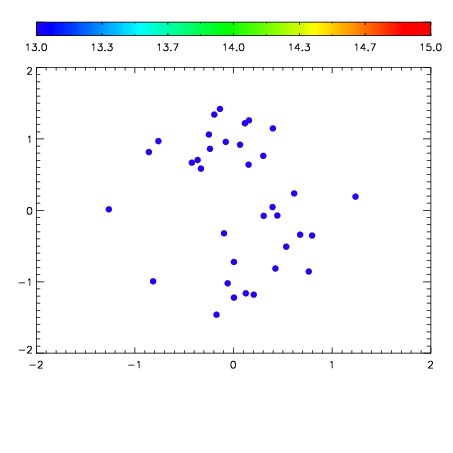

| Frame | Nreads | Zeropoints | Mag plots | Spatial mag deviation | Spatial sky 16325A emission deviations (filled: sky, open: star) | Spatial sky continuum emission | Spatial sky telluric CO2 absorption deviations (filled: H < 10) | |||||||||||||||||||||||
| 0 | 0 |
|
|
|
|
|
|
| IPAIR | NAME | SHIFT | NEWSHIFT | S/N | NAME | SHIFT | NEWSHIFT | S/N |
| 0 | 09990055 | 1.00954 | 0.00000 | 186.128 | 09990050 | 0.525033 | 0.484507 | 194.494 |
| 1 | 09990049 | 0.525480 | 0.484060 | 186.205 | 09990051 | -0.000269991 | 1.00981 | 185.783 |
| 2 | 09990056 | 0.529068 | 0.480472 | 185.266 | 09990048 | 0.00000 | 1.00954 | 182.551 |
| 3 | 09990053 | 0.523531 | 0.486009 | 174.755 | 09990052 | -0.000281714 | 1.00982 | 172.623 |