| Red | Green | Blue | |
| z | 17.64 | ||
| znorm | Inf | ||
| sky | -Inf | -Inf | -Inf |
| S/N | 30.6 | 53.1 | 57.0 |
| S/N(c) | 0.0 | 0.0 | 0.0 |
| SN(E/C) |
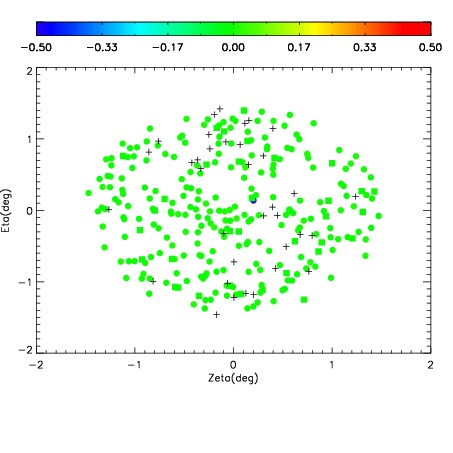
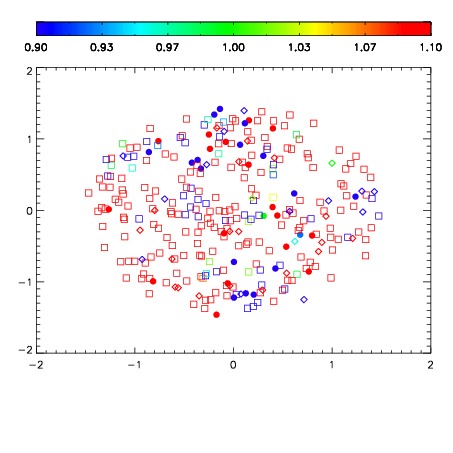
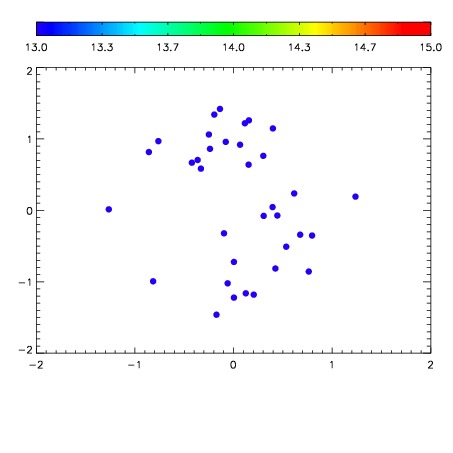

| Frame | Nreads | Zeropoints | Mag plots | Spatial mag deviation | Spatial sky 16325A emission deviations (filled: sky, open: star) | Spatial sky continuum emission | Spatial sky telluric CO2 absorption deviations (filled: H < 10) | |||||||||||||||||||||||
| 0 | 0 |
|
|
|
|
|
|
| IPAIR | NAME | SHIFT | NEWSHIFT | S/N | NAME | SHIFT | NEWSHIFT | S/N |
| 0 | 10220063 | 0.497866 | 0.00000 | 210.953 | 10220061 | 0.00000 | 0.497866 | 213.065 |
| 1 | 10220066 | 0.494506 | 0.00336000 | 212.948 | 10220065 | 0.00145128 | 0.496415 | 214.696 |
| 2 | 10220067 | 0.493955 | 0.00391102 | 205.889 | 10220068 | 0.00133053 | 0.496535 | 211.327 |
| 3 | 10220062 | 0.496669 | 0.00119701 | 203.637 | 10220064 | 0.00103854 | 0.496827 | 210.332 |