| Red | Green | Blue | |
| z | 17.64 | ||
| znorm | Inf | ||
| sky | -Inf | -Inf | -Inf |
| S/N | 26.9 | 49.4 | 50.2 |
| S/N(c) | 0.0 | 0.0 | 0.0 |
| SN(E/C) |
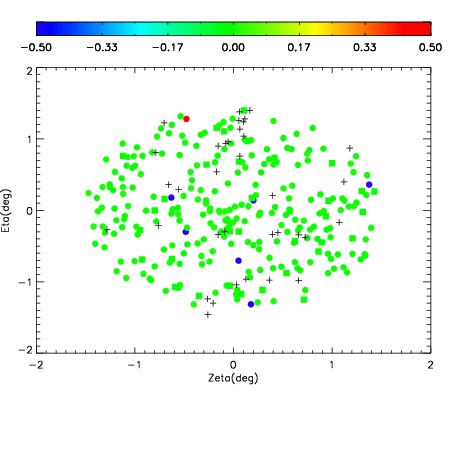
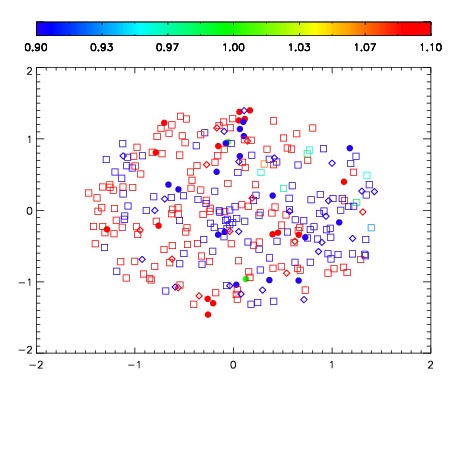
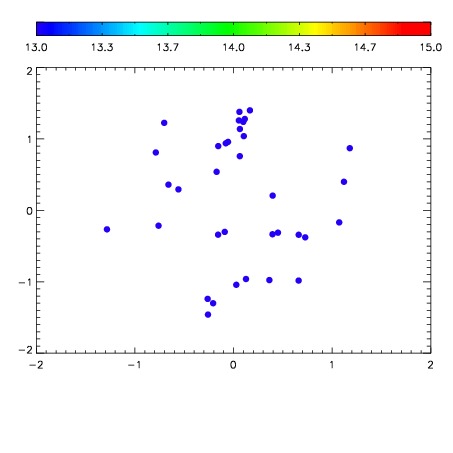

| Frame | Nreads | Zeropoints | Mag plots | Spatial mag deviation | Spatial sky 16325A emission deviations (filled: sky, open: star) | Spatial sky continuum emission | Spatial sky telluric CO2 absorption deviations (filled: H < 10) | |||||||||||||||||||||||
| 0 | 0 |
|
|
|
|
|
|
| IPAIR | NAME | SHIFT | NEWSHIFT | S/N | NAME | SHIFT | NEWSHIFT | S/N |
| 0 | 10460064 | 0.508280 | 0.00000 | 162.600 | 10460063 | 0.00147293 | 0.506807 | 162.150 |
| 1 | 10460061 | 0.504387 | 0.00389296 | 174.284 | 10460062 | 0.000425916 | 0.507854 | 174.263 |
| 2 | 10460060 | 0.503629 | 0.00465095 | 172.221 | 10460059 | 0.00000 | 0.508280 | 165.513 |
| 3 | 10460065 | 0.507843 | 0.000436962 | 156.487 | 10460066 | 0.00463110 | 0.503649 | 151.549 |