| Red | Green | Blue | |
| z | 17.64 | ||
| znorm | Inf | ||
| sky | -Inf | -Inf | -Inf |
| S/N | 23.7 | 43.1 | 44.7 |
| S/N(c) | 0.0 | 0.0 | 0.0 |
| SN(E/C) |

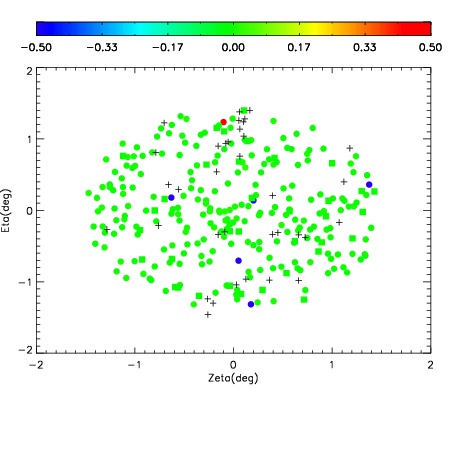
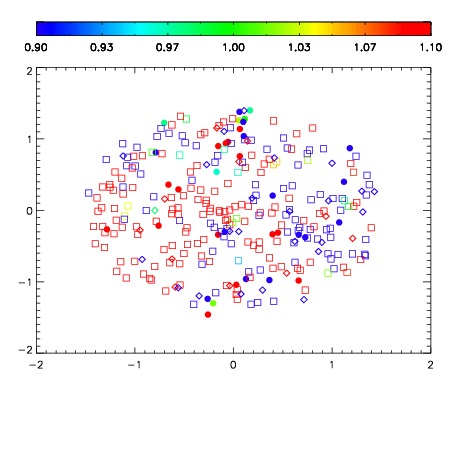
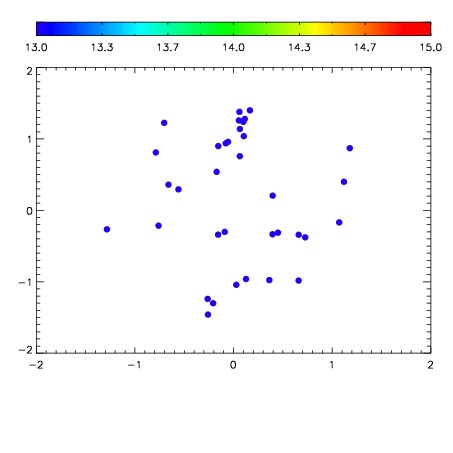

| Frame | Nreads | Zeropoints | Mag plots | Spatial mag deviation | Spatial sky 16325A emission deviations (filled: sky, open: star) | Spatial sky continuum emission | Spatial sky telluric CO2 absorption deviations (filled: H < 10) | |||||||||||||||||||||||
| 0 | 0 |
|
|
|
|
|
|
| IPAIR | NAME | SHIFT | NEWSHIFT | S/N | NAME | SHIFT | NEWSHIFT | S/N |
| 0 | 10800043 | 0.491060 | 0.00000 | 164.139 | 10800041 | -0.00168558 | 0.492746 | 157.172 |
| 1 | 10800038 | 0.489843 | 0.00121698 | 182.882 | 10800037 | 0.00000 | 0.491060 | 187.822 |
| 2 | 10800039 | 0.489945 | 0.00111499 | 170.654 | 10800040 | -0.00212640 | 0.493186 | 173.379 |
| 3 | 10800042 | 0.490328 | 0.000731975 | 166.055 | 10800044 | -0.00119943 | 0.492259 | 166.166 |