| Red | Green | Blue | |
| z | 17.64 | ||
| znorm | Inf | ||
| sky | -Inf | -Inf | -Inf |
| S/N | 28.1 | 46.9 | 49.5 |
| S/N(c) | 0.0 | 0.0 | 0.0 |
| SN(E/C) |
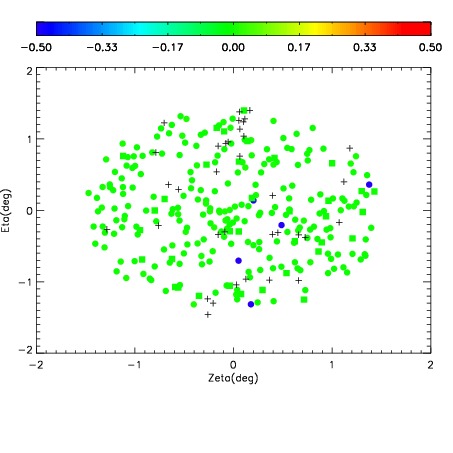

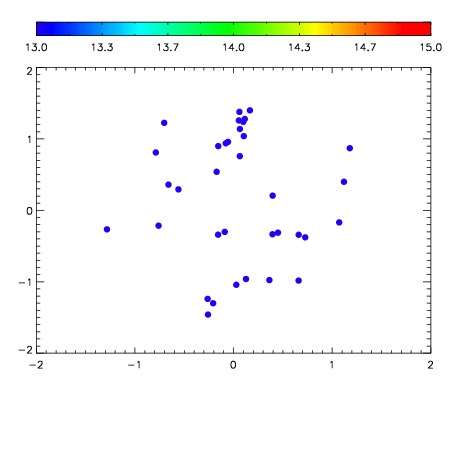

| Frame | Nreads | Zeropoints | Mag plots | Spatial mag deviation | Spatial sky 16325A emission deviations (filled: sky, open: star) | Spatial sky continuum emission | Spatial sky telluric CO2 absorption deviations (filled: H < 10) | |||||||||||||||||||||||
| 0 | 0 |
|
|
|
|
|
|
| IPAIR | NAME | SHIFT | NEWSHIFT | S/N | NAME | SHIFT | NEWSHIFT | S/N |
| 0 | 11140020 | 0.483959 | 0.00000 | 155.655 | 11140019 | 0.00126744 | 0.482692 | 151.183 |
| 1 | 11140013 | 0.483510 | 0.000449002 | 186.692 | 11140011 | 0.00000 | 0.483959 | 182.163 |
| 2 | 11140012 | 0.483309 | 0.000649989 | 180.363 | 11140014 | -0.000798505 | 0.484757 | 175.357 |
| 3 | 11140016 | 0.482870 | 0.00108898 | 168.536 | 11140015 | -0.000781105 | 0.484740 | 168.978 |
| 4 | 11140017 | 0.483856 | 0.000102997 | 166.456 | 11140018 | 0.000719860 | 0.483239 | 159.844 |