| Red | Green | Blue | |
| z | 17.64 | ||
| znorm | Inf | ||
| sky | -Inf | -Inf | -Inf |
| S/N | 24.6 | 42.0 | 47.4 |
| S/N(c) | 0.0 | 0.0 | 0.0 |
| SN(E/C) |
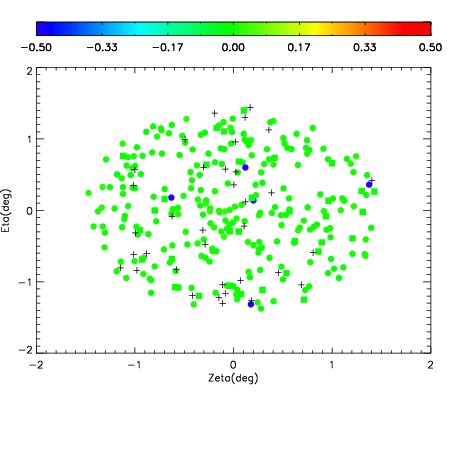
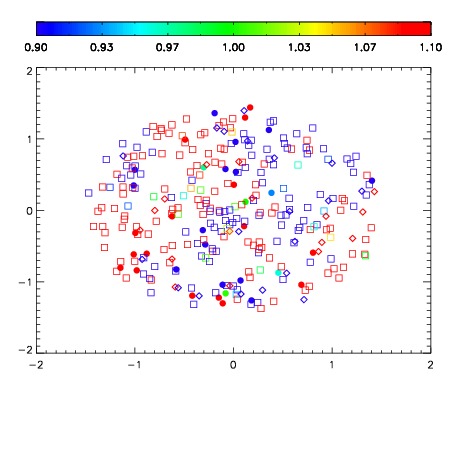
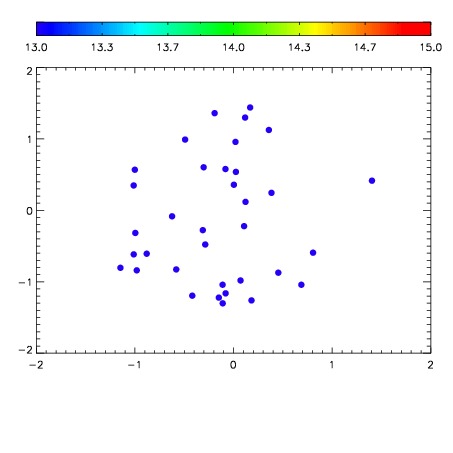

| Frame | Nreads | Zeropoints | Mag plots | Spatial mag deviation | Spatial sky 16325A emission deviations (filled: sky, open: star) | Spatial sky continuum emission | Spatial sky telluric CO2 absorption deviations (filled: H < 10) | |||||||||||||||||||||||
| 0 | 0 |
|
|
|
|
|
|
| IPAIR | NAME | SHIFT | NEWSHIFT | S/N | NAME | SHIFT | NEWSHIFT | S/N |
| 0 | 10820041 | 0.485532 | 0.00000 | 209.688 | 10820042 | -0.000956126 | 0.486488 | 202.669 |
| 1 | 10820040 | 0.485199 | 0.000332981 | 189.468 | 10820039 | -0.000598759 | 0.486131 | 188.738 |
| 2 | 10820037 | 0.485184 | 0.000347972 | 173.456 | 10820038 | -0.000996736 | 0.486529 | 188.270 |
| 3 | 10820036 | 0.485479 | 5.29885e-05 | 170.288 | 10820035 | 0.00000 | 0.485532 | 181.681 |