| Red | Green | Blue | |
| z | 17.64 | ||
| znorm | Inf | ||
| sky | -Inf | -Inf | -Inf |
| S/N | 30.4 | 51.4 | 55.5 |
| S/N(c) | 0.0 | 0.0 | 0.0 |
| SN(E/C) |

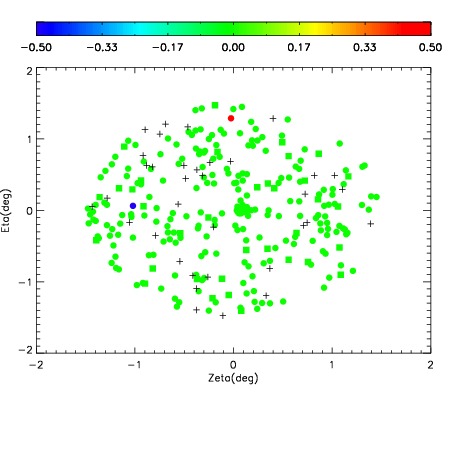
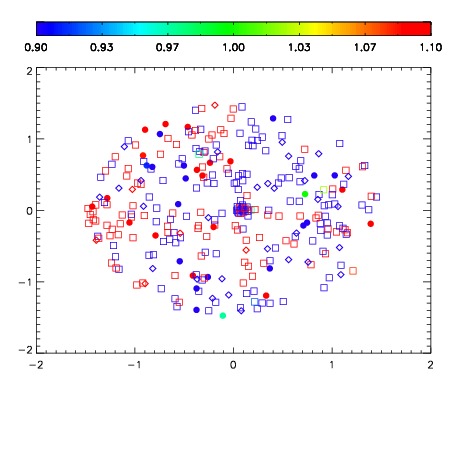
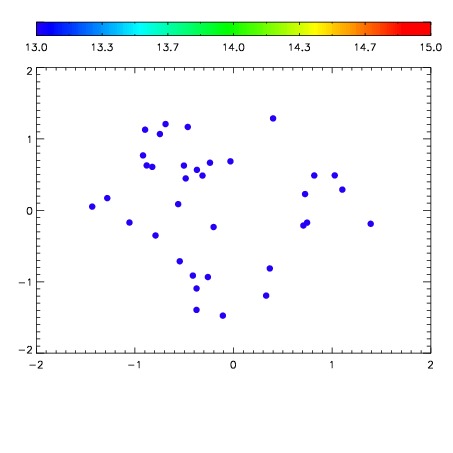

| Frame | Nreads | Zeropoints | Mag plots | Spatial mag deviation | Spatial sky 16325A emission deviations (filled: sky, open: star) | Spatial sky continuum emission | Spatial sky telluric CO2 absorption deviations (filled: H < 10) | |||||||||||||||||||||||
| 0 | 0 |
|
|
|
|
|
|
| IPAIR | NAME | SHIFT | NEWSHIFT | S/N | NAME | SHIFT | NEWSHIFT | S/N |
| 0 | 06310013 | 0.477812 | 0.00000 | 260.074 | 06310011 | 0.00000 | 0.477812 | 255.404 |
| 1 | 06310017 | 0.477719 | 9.29832e-05 | 264.533 | 06310018 | -0.000549713 | 0.478362 | 265.054 |
| 2 | 06310016 | 0.476994 | 0.000817984 | 261.485 | 06310014 | -0.000209290 | 0.478021 | 261.160 |
| 3 | 06310012 | 0.476840 | 0.000972003 | 260.853 | 06310015 | -0.00352095 | 0.481333 | 257.319 |