| Red | Green | Blue | |
| z | 17.64 | ||
| znorm | Inf | ||
| sky | -Inf | -Inf | -Inf |
| S/N | 8.1 | 15.6 | 17.2 |
| S/N(c) | 0.0 | 0.0 | 0.0 |
| SN(E/C) |
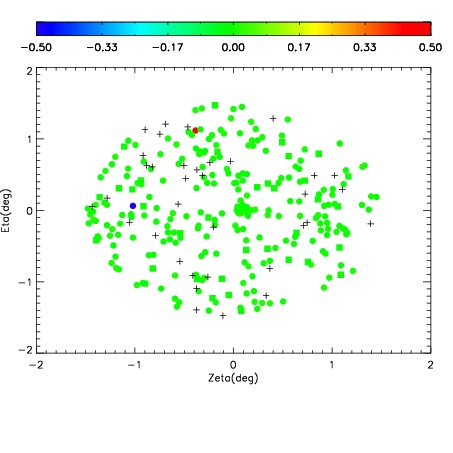
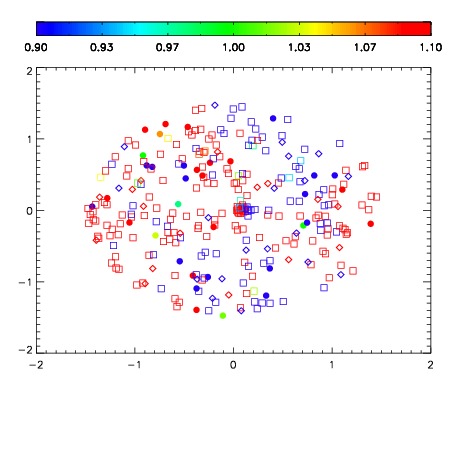
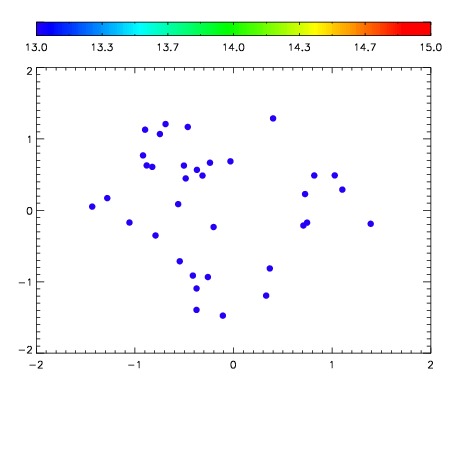

| Frame | Nreads | Zeropoints | Mag plots | Spatial mag deviation | Spatial sky 16325A emission deviations (filled: sky, open: star) | Spatial sky continuum emission | Spatial sky telluric CO2 absorption deviations (filled: H < 10) | |||||||||||||||||||||||
| 0 | 0 |
|
|
|
|
|
|
| IPAIR | NAME | SHIFT | NEWSHIFT | S/N | NAME | SHIFT | NEWSHIFT | S/N |
| 0 | 06620016 | 0.486773 | 0.00000 | 61.0389 | 06620017 | 0.00540548 | 0.481368 | 73.9958 |
| 1 | 06620011 | 0.484007 | 0.00276601 | 141.756 | 06620010 | 0.00000 | 0.486773 | 150.075 |
| 2 | 06620012 | 0.484335 | 0.00243801 | 132.720 | 06620013 | 0.00659300 | 0.480180 | 135.786 |
| 3 | 06620015 | 0.486514 | 0.000259012 | 105.988 | 06620014 | 0.00313547 | 0.483638 | 75.0014 |