| Red | Green | Blue | |
| z | 17.64 | ||
| znorm | Inf | ||
| sky | -Inf | -Inf | -Inf |
| S/N | 25.5 | 44.0 | 47.1 |
| S/N(c) | 0.0 | 0.0 | 0.0 |
| SN(E/C) |
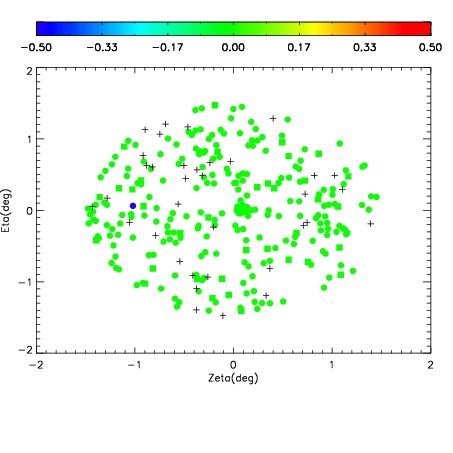
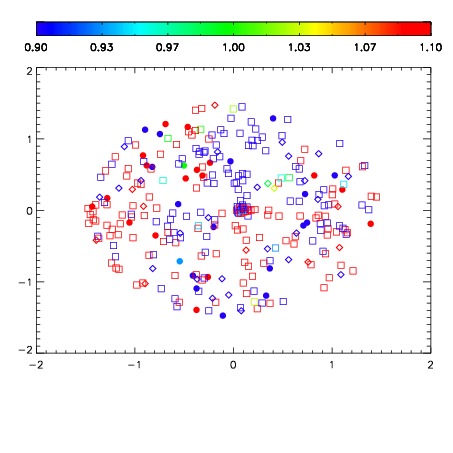
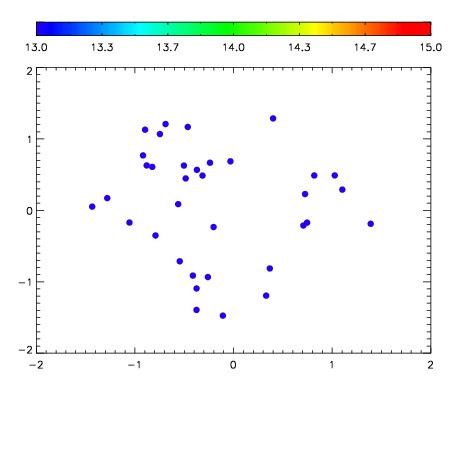

| Frame | Nreads | Zeropoints | Mag plots | Spatial mag deviation | Spatial sky 16325A emission deviations (filled: sky, open: star) | Spatial sky continuum emission | Spatial sky telluric CO2 absorption deviations (filled: H < 10) | |||||||||||||||||||||||
| 0 | 0 |
|
|
|
|
|
|
| IPAIR | NAME | SHIFT | NEWSHIFT | S/N | NAME | SHIFT | NEWSHIFT | S/N |
| 0 | 06660016 | 0.487892 | 0.00000 | 204.836 | 06660017 | 0.000356126 | 0.487536 | 207.114 |
| 1 | 06660011 | 0.484400 | 0.00349200 | 214.206 | 06660014 | -0.000278497 | 0.488171 | 215.274 |
| 2 | 06660012 | 0.484413 | 0.00347900 | 209.665 | 06660013 | 0.00275022 | 0.485142 | 210.980 |
| 3 | 06660015 | 0.487123 | 0.000768989 | 204.087 | 06660010 | 0.00000 | 0.487892 | 206.550 |