| Red | Green | Blue | |
| z | 17.64 | ||
| znorm | Inf | ||
| sky | -NaN | -Inf | -Inf |
| S/N | 29.9 | 49.6 | 53.5 |
| S/N(c) | 0.0 | 0.0 | 0.0 |
| SN(E/C) |
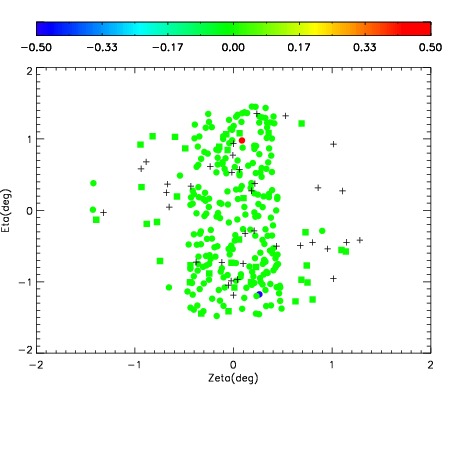
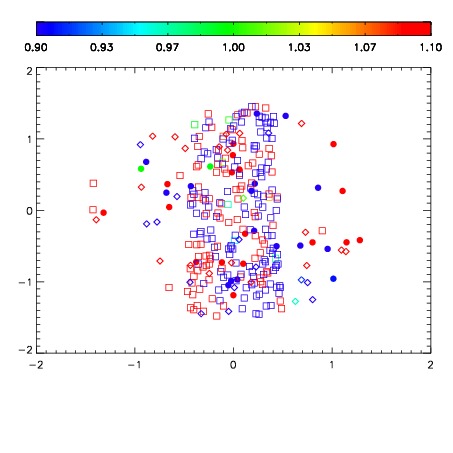
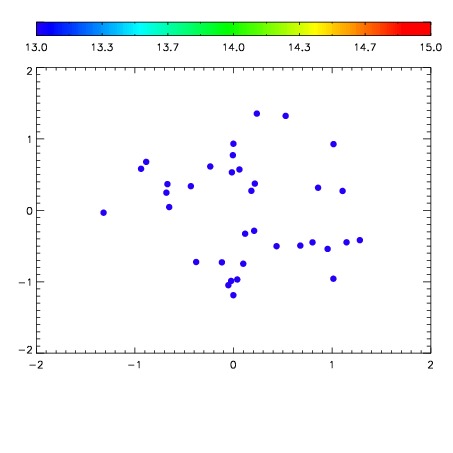

| Frame | Nreads | Zeropoints | Mag plots | Spatial mag deviation | Spatial sky 16325A emission deviations (filled: sky, open: star) | Spatial sky continuum emission | Spatial sky telluric CO2 absorption deviations (filled: H < 10) | |||||||||||||||||||||||
| 0 | 0 |
|
|
|
|
|
|
| IPAIR | NAME | SHIFT | NEWSHIFT | S/N | NAME | SHIFT | NEWSHIFT | S/N |
| 0 | 06920032 | 0.499957 | 0.00000 | 216.343 | 06920026 | 0.00000 | 0.499957 | 214.407 |
| 1 | 06920027 | 0.496975 | 0.00298199 | 219.122 | 06920030 | 0.000523444 | 0.499434 | 214.590 |
| 2 | 06920028 | 0.497480 | 0.00247699 | 214.605 | 06920029 | 0.00805052 | 0.491906 | 212.689 |
| 3 | 06920031 | 0.499806 | 0.000151008 | 213.629 | 06920033 | 0.00576019 | 0.494197 | 212.023 |