| Red | Green | Blue | |
| z | 17.64 | ||
| znorm | Inf | ||
| sky | -Inf | -Inf | -Inf |
| S/N | 28.4 | 48.1 | 52.8 |
| S/N(c) | 0.0 | 0.0 | 0.0 |
| SN(E/C) |
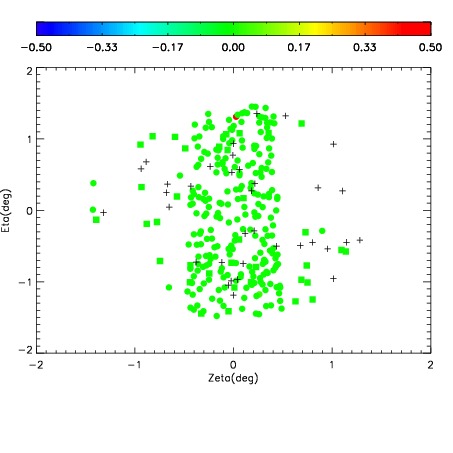
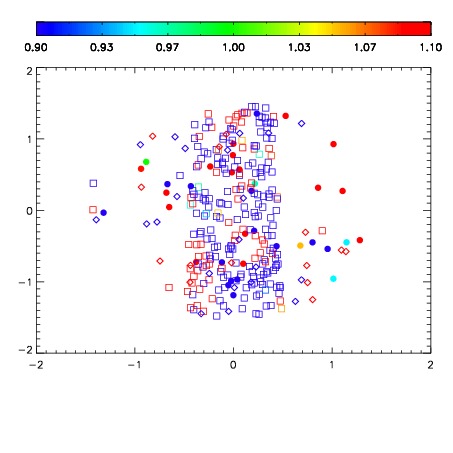
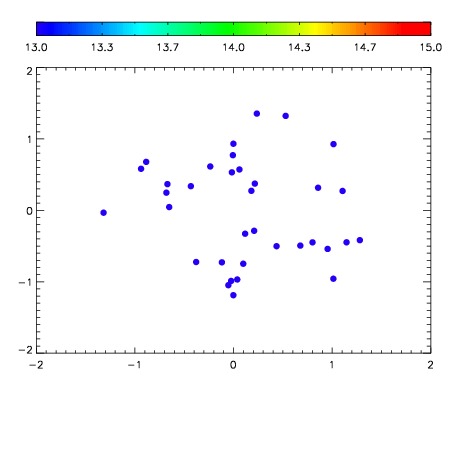

| Frame | Nreads | Zeropoints | Mag plots | Spatial mag deviation | Spatial sky 16325A emission deviations (filled: sky, open: star) | Spatial sky continuum emission | Spatial sky telluric CO2 absorption deviations (filled: H < 10) | |||||||||||||||||||||||
| 0 | 0 |
|
|
|
|
|
|
| IPAIR | NAME | SHIFT | NEWSHIFT | S/N | NAME | SHIFT | NEWSHIFT | S/N |
| 0 | 09970045 | 0.519073 | 0.00000 | 225.737 | 09970044 | 0.00000 | 0.519073 | 221.507 |
| 1 | 09970050 | 0.516053 | 0.00301999 | 231.735 | 09970051 | -0.00116955 | 0.520243 | 229.412 |
| 2 | 09970046 | 0.518740 | 0.000333011 | 227.596 | 09970047 | 0.00343476 | 0.515638 | 225.856 |
| 3 | 09970049 | 0.516028 | 0.00304502 | 227.116 | 09970048 | 0.00300006 | 0.516073 | 222.586 |