| Red | Green | Blue | |
| z | 17.64 | ||
| znorm | Inf | ||
| sky | -Inf | -Inf | -Inf |
| S/N | 14.3 | 26.9 | 32.1 |
| S/N(c) | 0.0 | 0.0 | 0.0 |
| SN(E/C) |
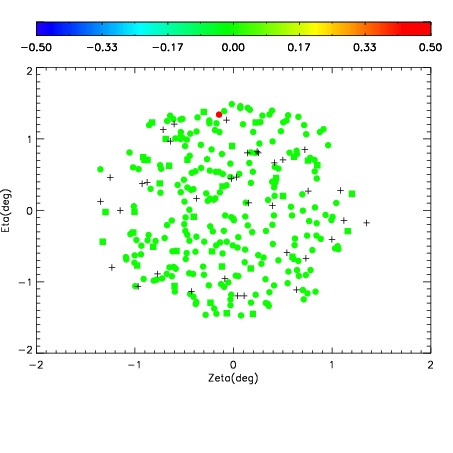
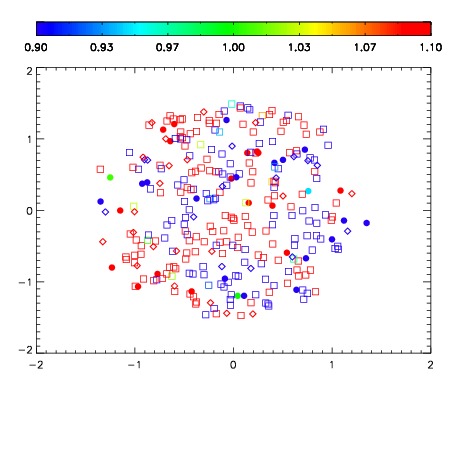
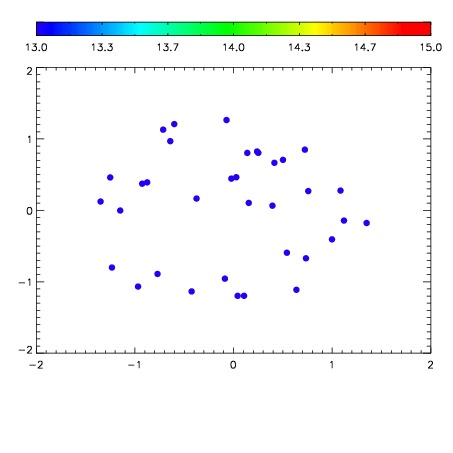

| Frame | Nreads | Zeropoints | Mag plots | Spatial mag deviation | Spatial sky 16325A emission deviations (filled: sky, open: star) | Spatial sky continuum emission | Spatial sky telluric CO2 absorption deviations (filled: H < 10) | |||||||||||||||||||||||
| 0 | 0 |
|
|
|
|
|
|
| IPAIR | NAME | SHIFT | NEWSHIFT | S/N | NAME | SHIFT | NEWSHIFT | S/N |
| 0 | 06900024 | 0.495065 | 0.00000 | 128.945 | 06900022 | 0.00000 | 0.495065 | 118.378 |
| 1 | 06900023 | 0.494878 | 0.000187010 | 160.990 | 06900026 | 0.00137280 | 0.493692 | 167.193 |
| 2 | 06900028 | 0.494643 | 0.000422001 | 143.349 | 06900030 | 0.00574596 | 0.489319 | 128.178 |
| 3 | 06900027 | 0.493934 | 0.00113100 | 111.398 | 06900029 | 0.00901522 | 0.486050 | 116.505 |
| 4 | 06900031 | 0.493395 | 0.00167000 | 109.706 | 06900025 | 0.000461878 | 0.494603 | 97.3476 |
| 5 | 06900032 | 0.493655 | 0.00141001 | 107.273 | 06900033 | 0.00592016 | 0.489145 | 83.2414 |