| Red | Green | Blue | |
| z | 17.64 | ||
| znorm | Inf | ||
| sky | -Inf | -Inf | -Inf |
| S/N | 28.9 | 47.7 | 53.1 |
| S/N(c) | 0.0 | 0.0 | 0.0 |
| SN(E/C) |
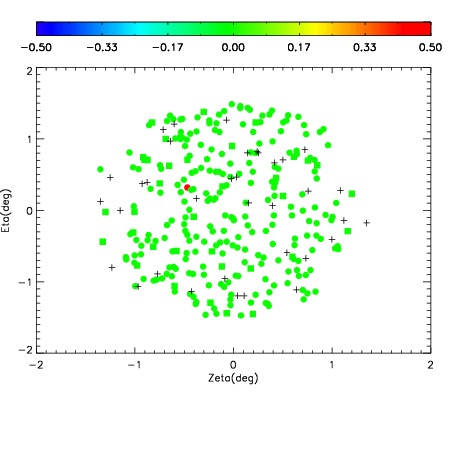
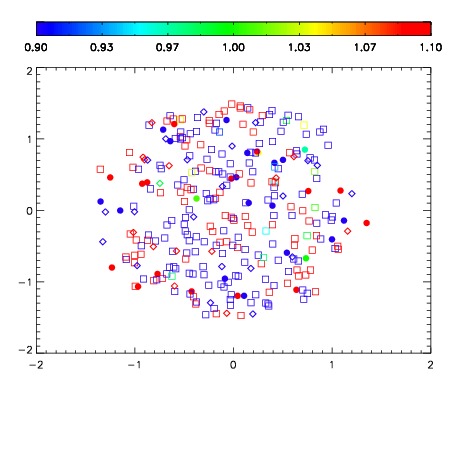


| Frame | Nreads | Zeropoints | Mag plots | Spatial mag deviation | Spatial sky 16325A emission deviations (filled: sky, open: star) | Spatial sky continuum emission | Spatial sky telluric CO2 absorption deviations (filled: H < 10) | |||||||||||||||||||||||
| 0 | 0 |
|
|
|
|
|
|
| IPAIR | NAME | SHIFT | NEWSHIFT | S/N | NAME | SHIFT | NEWSHIFT | S/N |
| 0 | 06940032 | 0.496801 | 0.00000 | 262.042 | 06940030 | 0.00283056 | 0.493970 | 258.804 |
| 1 | 06940031 | 0.496360 | 0.000440985 | 262.286 | 06940033 | 0.00561157 | 0.491189 | 262.708 |
| 2 | 06940028 | 0.496801 | 0.00000 | 257.079 | 06940029 | 0.00128536 | 0.495516 | 254.855 |
| 3 | 06940027 | 0.496243 | 0.000557989 | 255.401 | 06940026 | 0.00000 | 0.496801 | 254.851 |