| Red | Green | Blue | |
| z | 17.64 | ||
| znorm | Inf | ||
| sky | -Inf | -Inf | -Inf |
| S/N | 21.5 | 37.3 | 41.8 |
| S/N(c) | 0.0 | 0.0 | 0.0 |
| SN(E/C) |

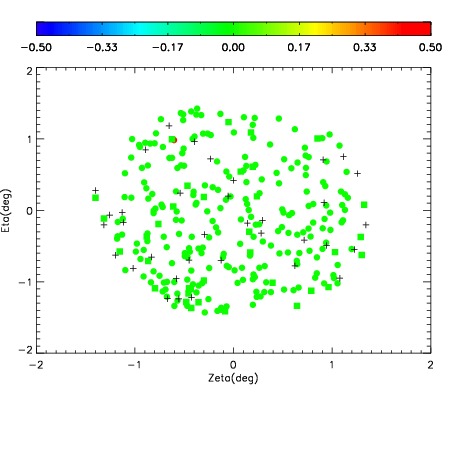
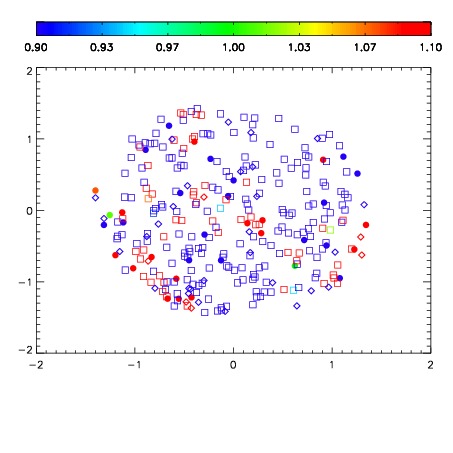
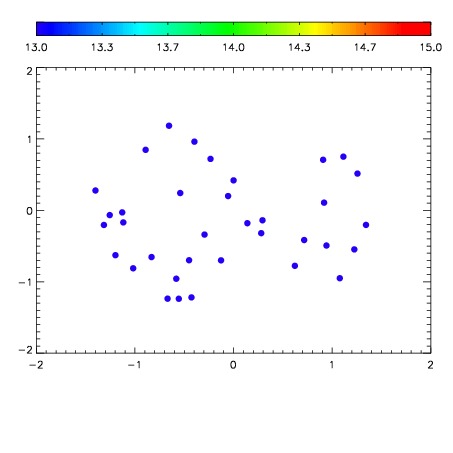

| Frame | Nreads | Zeropoints | Mag plots | Spatial mag deviation | Spatial sky 16325A emission deviations (filled: sky, open: star) | Spatial sky continuum emission | Spatial sky telluric CO2 absorption deviations (filled: H < 10) | |||||||||||||||||||||||
| 0 | 0 |
|
|
|
|
|
|
| IPAIR | NAME | SHIFT | NEWSHIFT | S/N | NAME | SHIFT | NEWSHIFT | S/N |
| 0 | 07540032 | 0.475082 | 0.00000 | 170.020 | 07540029 | 0.00181471 | 0.473267 | 178.979 |
| 1 | 07540031 | 0.474859 | 0.000223011 | 180.779 | 07540030 | -0.00188758 | 0.476970 | 183.996 |
| 2 | 07540028 | 0.473116 | 0.00196600 | 153.051 | 07540033 | 0.00132208 | 0.473760 | 171.997 |
| 3 | 07540027 | 0.471393 | 0.00368902 | 134.937 | 07540026 | 0.00000 | 0.475082 | 145.460 |