| Red | Green | Blue | |
| z | 17.64 | ||
| znorm | Inf | ||
| sky | -Inf | -Inf | -Inf |
| S/N | 29.1 | 48.6 | 55.1 |
| S/N(c) | 0.0 | 0.0 | 0.0 |
| SN(E/C) |

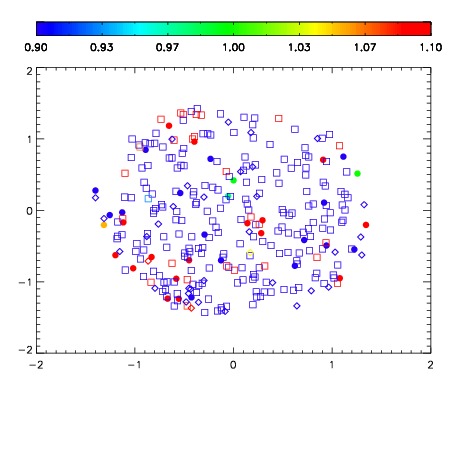
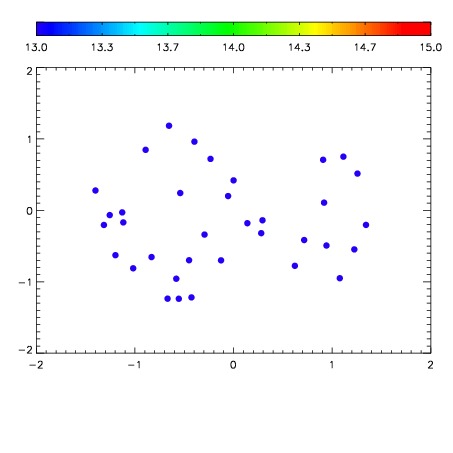

| Frame | Nreads | Zeropoints | Mag plots | Spatial mag deviation | Spatial sky 16325A emission deviations (filled: sky, open: star) | Spatial sky continuum emission | Spatial sky telluric CO2 absorption deviations (filled: H < 10) | |||||||||||||||||||||||
| 0 | 0 |
|
|
|
|
|
|
| IPAIR | NAME | SHIFT | NEWSHIFT | S/N | NAME | SHIFT | NEWSHIFT | S/N |
| 0 | 09980088 | 0.521056 | 0.00000 | 216.752 | 09980089 | 0.00253551 | 0.518520 | 219.299 |
| 1 | 09980092 | 0.519330 | 0.00172597 | 215.374 | 09980086 | 0.00000 | 0.521056 | 217.109 |
| 2 | 09980087 | 0.520583 | 0.000473022 | 214.933 | 09980093 | 0.00247111 | 0.518585 | 212.853 |
| 3 | 09980091 | 0.520316 | 0.000739992 | 203.866 | 09980090 | 0.00231981 | 0.518736 | 211.920 |