| Red | Green | Blue | |
| z | 17.64 | ||
| znorm | Inf | ||
| sky | -Inf | -Inf | -Inf |
| S/N | 26.9 | 47.2 | 51.2 |
| S/N(c) | 0.0 | 0.0 | 0.0 |
| SN(E/C) |
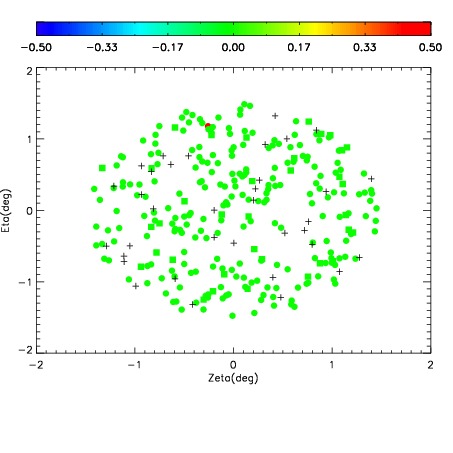
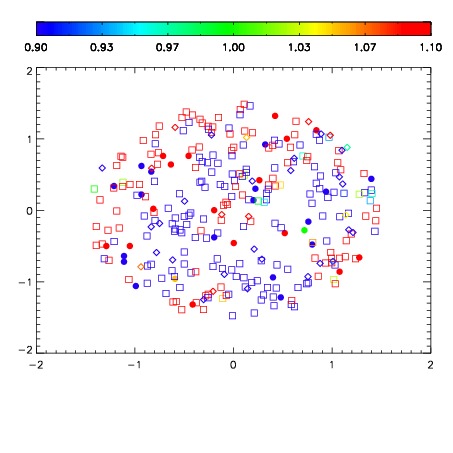
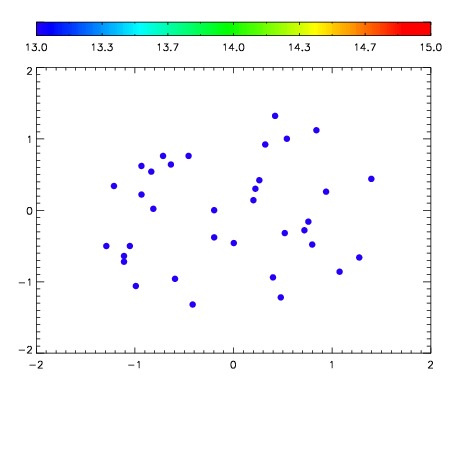

| Frame | Nreads | Zeropoints | Mag plots | Spatial mag deviation | Spatial sky 16325A emission deviations (filled: sky, open: star) | Spatial sky continuum emission | Spatial sky telluric CO2 absorption deviations (filled: H < 10) | |||||||||||||||||||||||
| 0 | 0 |
|
|
|
|
|
|
| IPAIR | NAME | SHIFT | NEWSHIFT | S/N | NAME | SHIFT | NEWSHIFT | S/N |
| 0 | 10210102 | 0.492714 | 0.00000 | 213.499 | 10210100 | 0.00258722 | 0.490127 | 212.736 |
| 1 | 10210097 | 0.490042 | 0.00267199 | 212.331 | 10210096 | 0.00000 | 0.492714 | 210.750 |
| 2 | 10210101 | 0.492340 | 0.000373989 | 210.531 | 10210103 | 0.00583022 | 0.486884 | 209.919 |
| 3 | 10210098 | 0.490902 | 0.00181198 | 208.302 | 10210099 | 0.00250236 | 0.490212 | 205.951 |