| Red | Green | Blue | |
| z | 17.64 | ||
| znorm | Inf | ||
| sky | -Inf | -Inf | -Inf |
| S/N | 19.9 | 37.0 | 38.9 |
| S/N(c) | 0.0 | 0.0 | 0.0 |
| SN(E/C) |

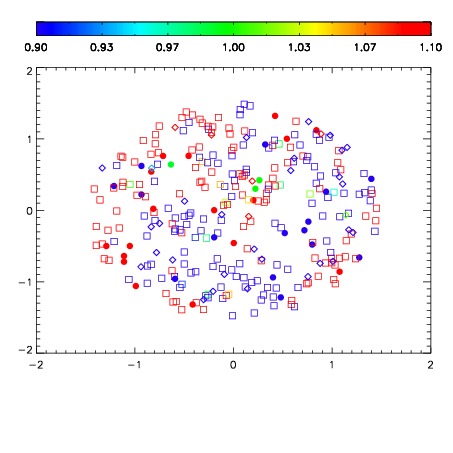
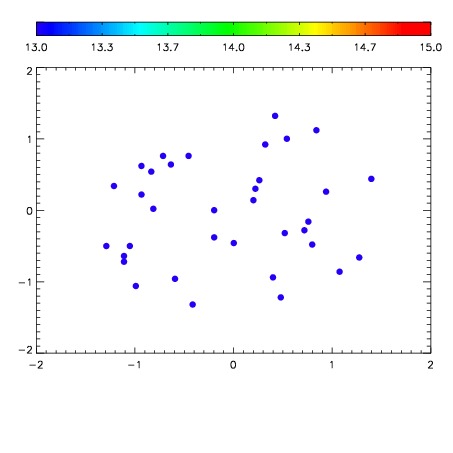

| Frame | Nreads | Zeropoints | Mag plots | Spatial mag deviation | Spatial sky 16325A emission deviations (filled: sky, open: star) | Spatial sky continuum emission | Spatial sky telluric CO2 absorption deviations (filled: H < 10) | |||||||||||||||||||||||
| 0 | 0 |
|
|
|
|
|
|
| IPAIR | NAME | SHIFT | NEWSHIFT | S/N | NAME | SHIFT | NEWSHIFT | S/N |
| 0 | 10610045 | 0.506124 | 0.00000 | 157.618 | 10610039 | 0.00000 | 0.506124 | 154.607 |
| 1 | 10610041 | 0.505877 | 0.000247002 | 189.422 | 10610042 | 0.00214234 | 0.503982 | 187.764 |
| 2 | 10610040 | 0.505568 | 0.000555992 | 159.209 | 10610043 | 0.00153969 | 0.504584 | 172.848 |
| 3 | 10610044 | 0.506095 | 2.90275e-05 | 155.775 | 10610046 | 0.00276682 | 0.503357 | 145.370 |