| Red | Green | Blue | |
| z | 17.64 | ||
| znorm | Inf | ||
| sky | -Inf | -Inf | -Inf |
| S/N | 27.4 | 48.8 | 51.7 |
| S/N(c) | 0.0 | 0.0 | 0.0 |
| SN(E/C) |

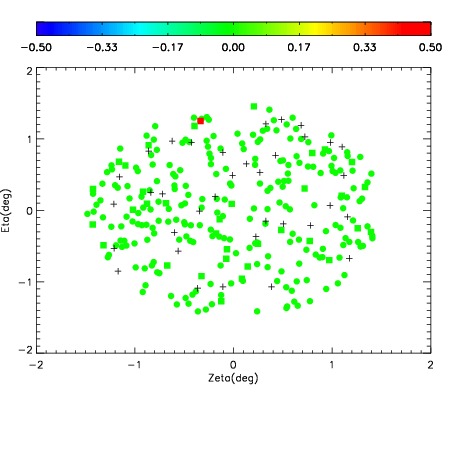
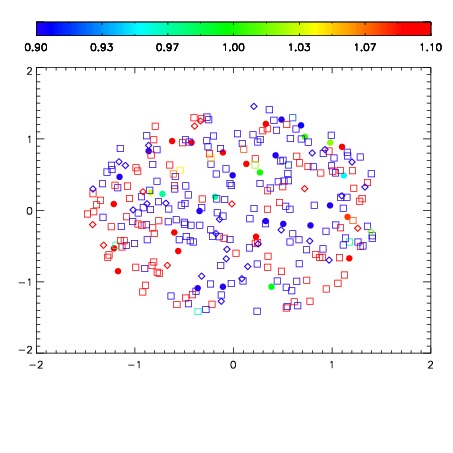


| Frame | Nreads | Zeropoints | Mag plots | Spatial mag deviation | Spatial sky 16325A emission deviations (filled: sky, open: star) | Spatial sky continuum emission | Spatial sky telluric CO2 absorption deviations (filled: H < 10) | |||||||||||||||||||||||
| 0 | 0 |
|
|
|
|
|
|
| IPAIR | NAME | SHIFT | NEWSHIFT | S/N | NAME | SHIFT | NEWSHIFT | S/N |
| 0 | 10250100 | 0.496356 | 0.00000 | 200.534 | 10250101 | 0.00457474 | 0.491781 | 203.110 |
| 1 | 10250103 | 0.495689 | 0.000667006 | 211.815 | 10250102 | 0.00472312 | 0.491633 | 211.817 |
| 2 | 10250096 | 0.491712 | 0.00464401 | 195.011 | 10250097 | 0.00362240 | 0.492734 | 197.464 |
| 3 | 10250099 | 0.494516 | 0.00184003 | 193.444 | 10250098 | 0.00446061 | 0.491895 | 197.349 |
| 4 | 10250095 | 0.491193 | 0.00516301 | 189.155 | 10250094 | 0.00000 | 0.496356 | 183.132 |