| Red | Green | Blue | |
| z | 17.64 | ||
| znorm | Inf | ||
| sky | -Inf | -Inf | -Inf |
| S/N | 23.7 | 41.1 | 44.2 |
| S/N(c) | 0.0 | 0.0 | 0.0 |
| SN(E/C) |

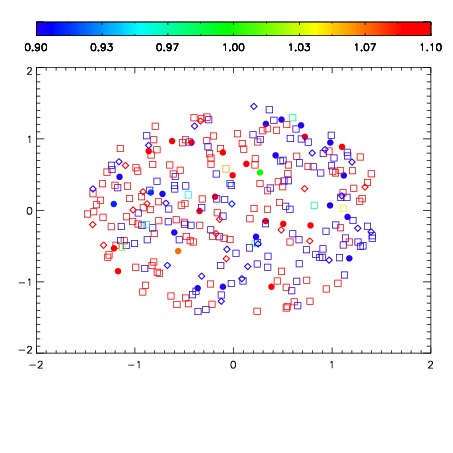
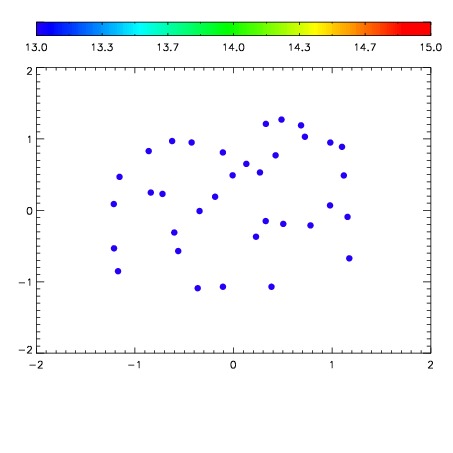

| Frame | Nreads | Zeropoints | Mag plots | Spatial mag deviation | Spatial sky 16325A emission deviations (filled: sky, open: star) | Spatial sky continuum emission | Spatial sky telluric CO2 absorption deviations (filled: H < 10) | |||||||||||||||||||||||
| 0 | 0 |
|
|
|
|
|
|
| IPAIR | NAME | SHIFT | NEWSHIFT | S/N | NAME | SHIFT | NEWSHIFT | S/N |
| 0 | 10310046 | 0.526850 | 0.00000 | 195.778 | 10310047 | 0.000787632 | 0.526062 | 136.971 |
| 1 | 10310049 | 0.525346 | 0.00150400 | 209.158 | 10310051 | 0.000422734 | 0.526427 | 204.167 |
| 2 | 10310050 | 0.525951 | 0.000898957 | 202.008 | 10310044 | 0.00000 | 0.526850 | 191.652 |
| 3 | 10310045 | 0.525730 | 0.00111997 | 201.130 | 10310048 | 0.000461487 | 0.526389 | 168.410 |