| Red | Green | Blue | |
| z | 17.64 | ||
| znorm | Inf | ||
| sky | -Inf | -Inf | -Inf |
| S/N | 4.2 | 7.4 | 8.1 |
| S/N(c) | 0.0 | 0.0 | 0.0 |
| SN(E/C) |
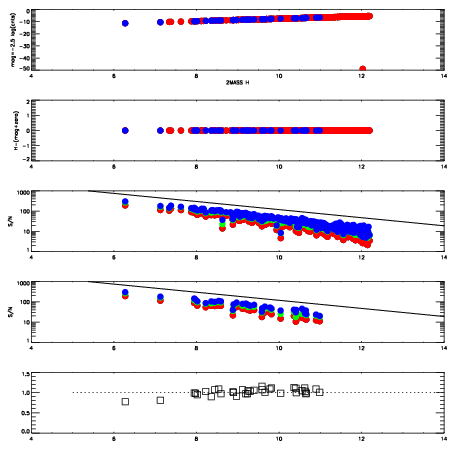
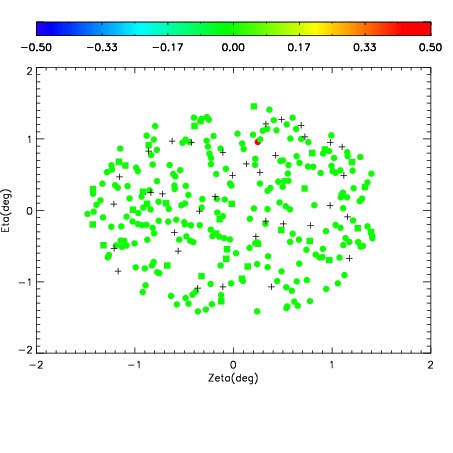
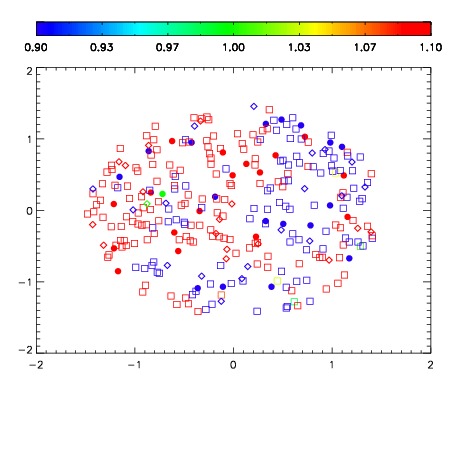
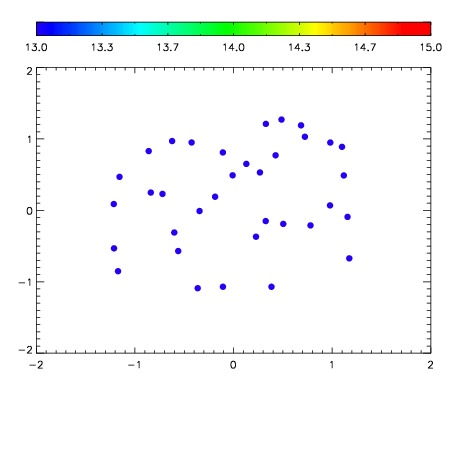

| Frame | Nreads | Zeropoints | Mag plots | Spatial mag deviation | Spatial sky 16325A emission deviations (filled: sky, open: star) | Spatial sky continuum emission | Spatial sky telluric CO2 absorption deviations (filled: H < 10) | |||||||||||||||||||||||
| 0 | 0 |
|
|
|
|
|
|
| IPAIR | NAME | SHIFT | NEWSHIFT | S/N | NAME | SHIFT | NEWSHIFT | S/N |
| 0 | 10540083 | 0.503250 | 0.00000 | 102.492 | 10540084 | 0.00166409 | 0.501586 | 82.6593 |
| 1 | 10540082 | 0.501977 | 0.00127298 | 111.293 | 10540081 | 0.00000 | 0.503250 | 95.8937 |
| 2 | 10540087 | 0.501797 | 0.00145298 | 83.5294 | 10540085 | 0.00153761 | 0.501712 | 54.4729 |
| 3 | 10540086 | 0.501930 | 0.00132000 | 44.7587 | 10540088 | 0.00502938 | 0.498221 | 29.8389 |