| Red | Green | Blue | |
| z | 17.64 | ||
| znorm | Inf | ||
| sky | -Inf | -Inf | -Inf |
| S/N | 23.4 | 41.3 | 45.3 |
| S/N(c) | 0.0 | 0.0 | 0.0 |
| SN(E/C) |
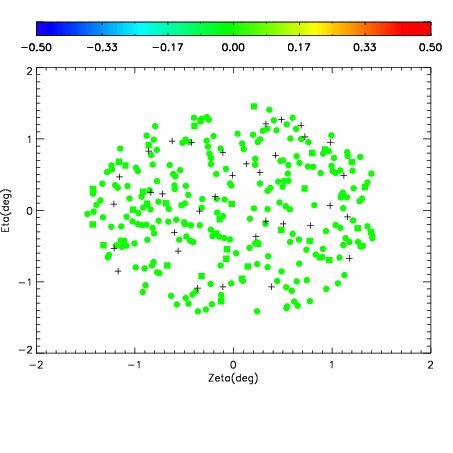

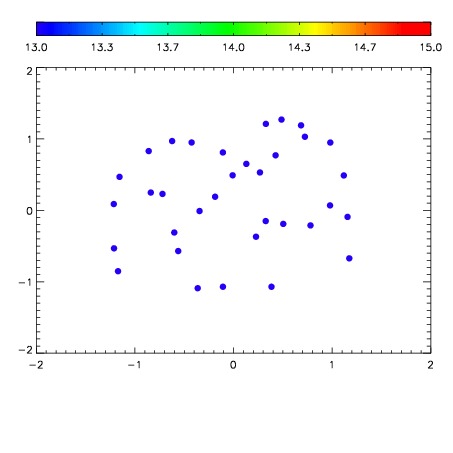

| Frame | Nreads | Zeropoints | Mag plots | Spatial mag deviation | Spatial sky 16325A emission deviations (filled: sky, open: star) | Spatial sky continuum emission | Spatial sky telluric CO2 absorption deviations (filled: H < 10) | |||||||||||||||||||||||
| 0 | 0 |
|
|
|
|
|
|
| IPAIR | NAME | SHIFT | NEWSHIFT | S/N | NAME | SHIFT | NEWSHIFT | S/N |
| 0 | 10750077 | 0.491012 | 0.00000 | 196.219 | 10750079 | -0.00104030 | 0.492052 | 208.580 |
| 1 | 10750074 | 0.490757 | 0.000255018 | 193.604 | 10750076 | -0.000300837 | 0.491313 | 198.584 |
| 2 | 10750073 | 0.490707 | 0.000304997 | 193.000 | 10750075 | -0.000718047 | 0.491730 | 194.004 |
| 3 | 10750078 | 0.489716 | 0.00129601 | 191.023 | 10750072 | 0.00000 | 0.491012 | 183.487 |