| Red | Green | Blue | |
| z | 17.64 | ||
| znorm | Inf | ||
| sky | -Inf | -Inf | -Inf |
| S/N | 28.3 | 47.2 | 52.8 |
| S/N(c) | 0.0 | 0.0 | 0.0 |
| SN(E/C) |
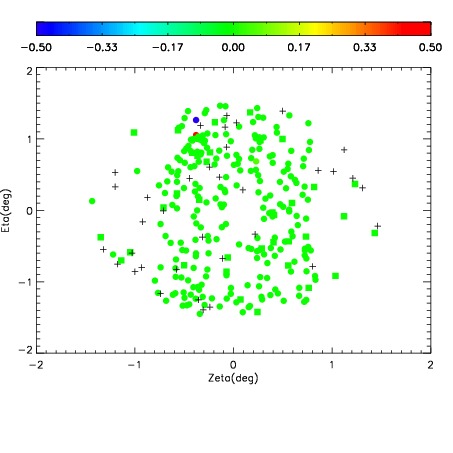
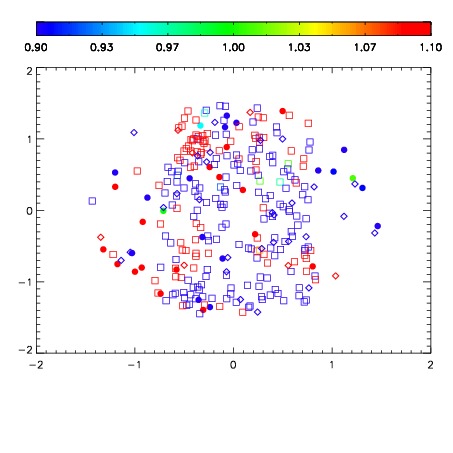
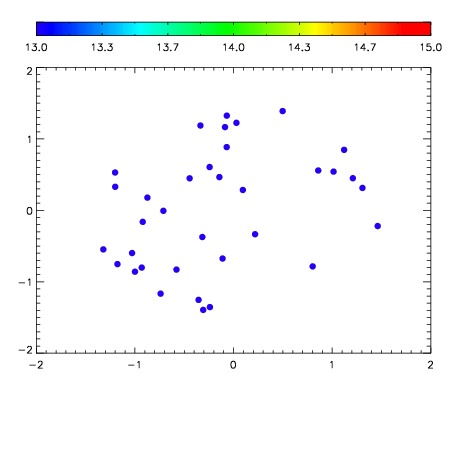

| Frame | Nreads | Zeropoints | Mag plots | Spatial mag deviation | Spatial sky 16325A emission deviations (filled: sky, open: star) | Spatial sky continuum emission | Spatial sky telluric CO2 absorption deviations (filled: H < 10) | |||||||||||||||||||||||
| 0 | 0 |
|
|
|
|
|
|
| IPAIR | NAME | SHIFT | NEWSHIFT | S/N | NAME | SHIFT | NEWSHIFT | S/N |
| 0 | 06980043 | 0.482159 | 0.00000 | 226.250 | 06980044 | 0.000111813 | 0.482047 | 219.317 |
| 1 | 06980042 | 0.481130 | 0.00102898 | 221.079 | 06980041 | -0.00233911 | 0.484498 | 215.027 |
| 2 | 06980039 | 0.481253 | 0.000905991 | 217.008 | 06980040 | 6.11707e-05 | 0.482098 | 214.511 |
| 3 | 06980038 | 0.480941 | 0.00121799 | 210.218 | 06980037 | 0.00000 | 0.482159 | 210.528 |