| Red | Green | Blue | |
| z | 17.64 | ||
| znorm | Inf | ||
| sky | -Inf | -Inf | -Inf |
| S/N | 27.8 | 47.4 | 49.9 |
| S/N(c) | 0.0 | 0.0 | 0.0 |
| SN(E/C) |
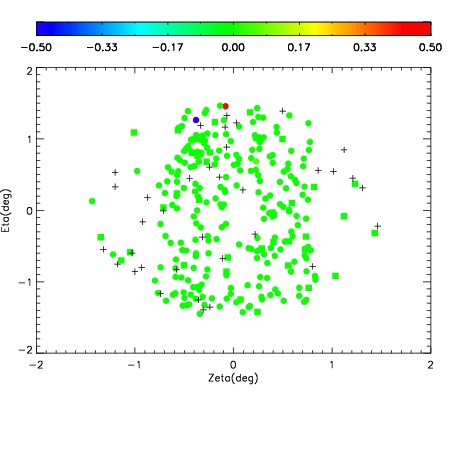
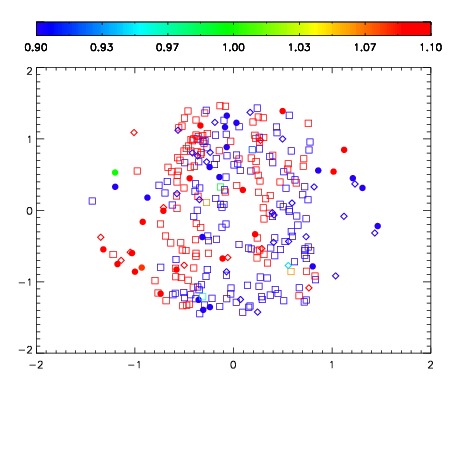
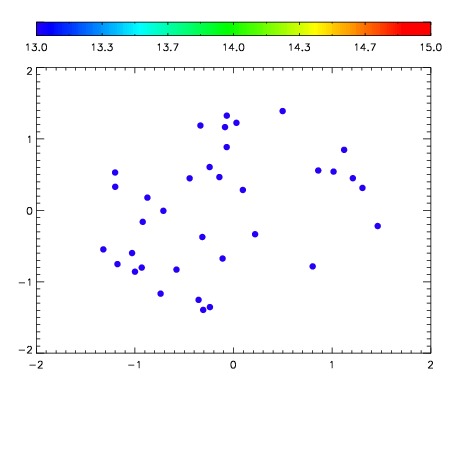

| Frame | Nreads | Zeropoints | Mag plots | Spatial mag deviation | Spatial sky 16325A emission deviations (filled: sky, open: star) | Spatial sky continuum emission | Spatial sky telluric CO2 absorption deviations (filled: H < 10) | |||||||||||||||||||||||
| 0 | 0 |
|
|
|
|
|
|
| IPAIR | NAME | SHIFT | NEWSHIFT | S/N | NAME | SHIFT | NEWSHIFT | S/N |
| 0 | 07020013 | 0.479924 | 0.00000 | 216.704 | 07020015 | -0.00187075 | 0.481795 | 217.173 |
| 1 | 07020012 | 0.477565 | 0.00235900 | 219.668 | 07020011 | 0.00000 | 0.479924 | 219.641 |
| 2 | 07020017 | 0.478817 | 0.00110701 | 213.929 | 07020014 | 0.000449677 | 0.479474 | 216.620 |
| 3 | 07020016 | 0.479449 | 0.000474989 | 209.943 | 07020018 | 0.000642290 | 0.479282 | 215.511 |