| Red | Green | Blue | |
| z | 17.64 | ||
| znorm | Inf | ||
| sky | -Inf | -NaN | -Inf |
| S/N | 29.8 | 51.0 | 54.8 |
| S/N(c) | 0.0 | 0.0 | 0.0 |
| SN(E/C) |

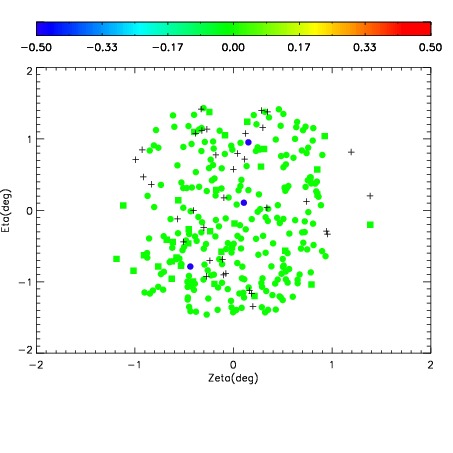
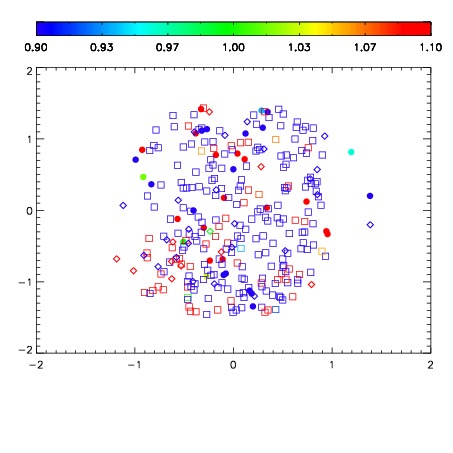
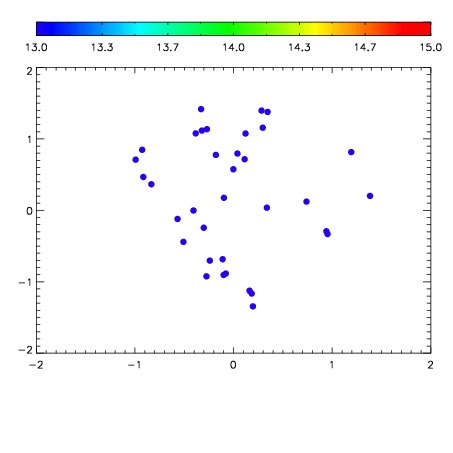

| Frame | Nreads | Zeropoints | Mag plots | Spatial mag deviation | Spatial sky 16325A emission deviations (filled: sky, open: star) | Spatial sky continuum emission | Spatial sky telluric CO2 absorption deviations (filled: H < 10) | |||||||||||||||||||||||
| 0 | 0 |
|
|
|
|
|
|
| IPAIR | NAME | SHIFT | NEWSHIFT | S/N | NAME | SHIFT | NEWSHIFT | S/N |
| 0 | 10260059 | 0.489531 | 0.00000 | 247.078 | 10260058 | 0.00000 | 0.489531 | 247.195 |
| 1 | 10260063 | 0.487426 | 0.00210500 | 244.335 | 10260062 | -0.000751675 | 0.490283 | 244.013 |
| 2 | 10260064 | 0.487637 | 0.00189400 | 242.832 | 10260065 | 0.000523153 | 0.489008 | 240.692 |
| 3 | 10260060 | 0.489165 | 0.000366002 | 229.947 | 10260061 | -0.000329174 | 0.489860 | 235.202 |