| Red | Green | Blue | |
| z | 17.64 | ||
| znorm | Inf | ||
| sky | -Inf | -Inf | -Inf |
| S/N | 29.9 | 53.4 | 55.9 |
| S/N(c) | 0.0 | 0.0 | 0.0 |
| SN(E/C) |
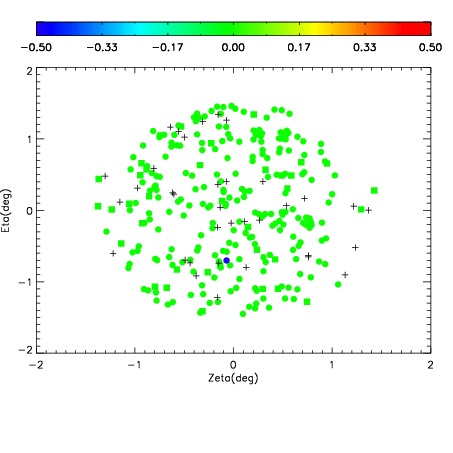
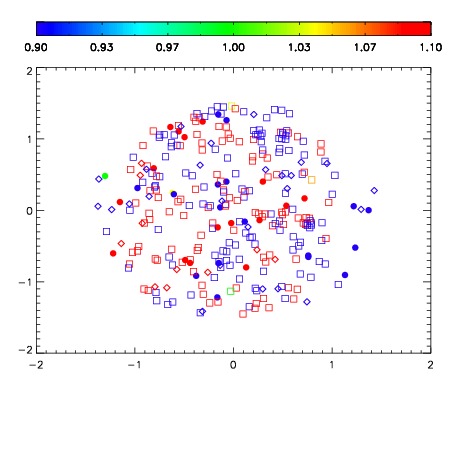
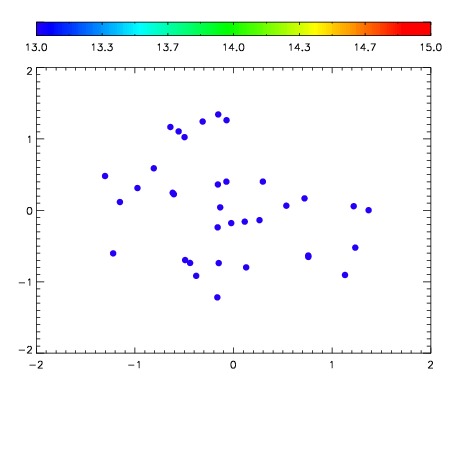

| Frame | Nreads | Zeropoints | Mag plots | Spatial mag deviation | Spatial sky 16325A emission deviations (filled: sky, open: star) | Spatial sky continuum emission | Spatial sky telluric CO2 absorption deviations (filled: H < 10) | |||||||||||||||||||||||
| 0 | 0 |
|
|
|
|
|
|
| IPAIR | NAME | SHIFT | NEWSHIFT | S/N | NAME | SHIFT | NEWSHIFT | S/N |
| 0 | 06950042 | 0.498874 | 0.00000 | 236.550 | 06950039 | -0.00107385 | 0.499948 | 232.730 |
| 1 | 06950037 | 0.493765 | 0.00510901 | 239.008 | 06950044 | 0.00163705 | 0.497237 | 234.155 |
| 2 | 06950038 | 0.494162 | 0.00471202 | 235.281 | 06950036 | 0.00000 | 0.498874 | 228.439 |
| 3 | 06950045 | 0.497021 | 0.00185302 | 229.932 | 06950043 | 0.00125634 | 0.497618 | 225.441 |
| 4 | 06950041 | 0.498194 | 0.000680000 | 228.567 | 06950040 | 0.00146418 | 0.497410 | 222.240 |