| Red | Green | Blue | |
| z | 17.64 | ||
| znorm | Inf | ||
| sky | -NaN | -Inf | -Inf |
| S/N | 36.7 | 63.0 | 68.1 |
| S/N(c) | 0.0 | 0.0 | 0.0 |
| SN(E/C) |
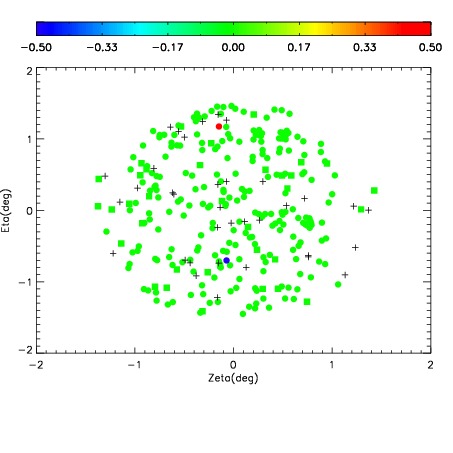
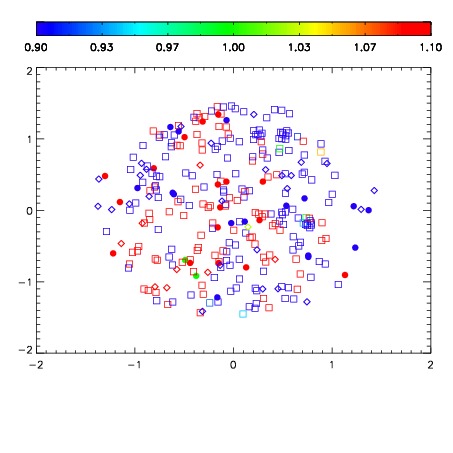
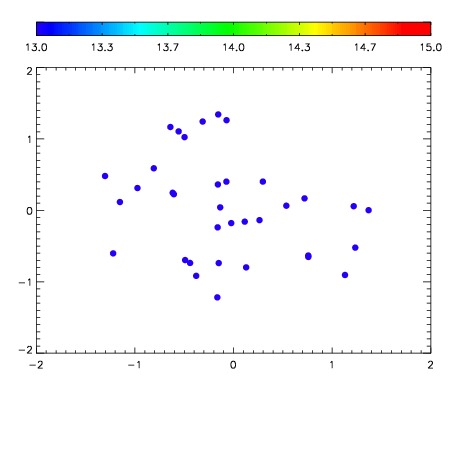

| Frame | Nreads | Zeropoints | Mag plots | Spatial mag deviation | Spatial sky 16325A emission deviations (filled: sky, open: star) | Spatial sky continuum emission | Spatial sky telluric CO2 absorption deviations (filled: H < 10) | |||||||||||||||||||||||
| 0 | 0 |
|
|
|
|
|
|
| IPAIR | NAME | SHIFT | NEWSHIFT | S/N | NAME | SHIFT | NEWSHIFT | S/N |
| 0 | 06990042 | 0.487860 | 0.00000 | 252.710 | 06990039 | 0.000630582 | 0.487229 | 255.783 |
| 1 | 06990041 | 0.479707 | 0.00815299 | 258.776 | 06990036 | 0.00000 | 0.487860 | 259.904 |
| 2 | 06990046 | 0.485495 | 0.00236499 | 258.737 | 06990043 | 0.000602247 | 0.487258 | 258.951 |
| 3 | 06990045 | 0.479548 | 0.00831199 | 258.676 | 06990044 | 0.00142268 | 0.486437 | 258.108 |
| 4 | 06990038 | 0.484941 | 0.00291899 | 256.231 | 06990047 | 0.000819177 | 0.487041 | 256.960 |
| 5 | 06990037 | 0.478335 | 0.00952500 | 255.920 | 06990040 | 0.000420838 | 0.487439 | 256.686 |