| Red | Green | Blue | |
| z | 17.64 | ||
| znorm | Inf | ||
| sky | -Inf | -Inf | -Inf |
| S/N | 16.9 | 29.6 | 32.9 |
| S/N(c) | 0.0 | 0.0 | 0.0 |
| SN(E/C) |
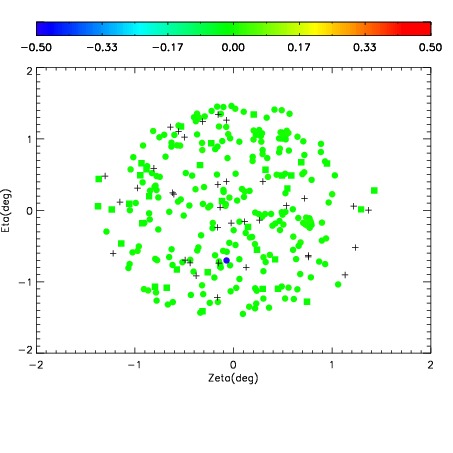
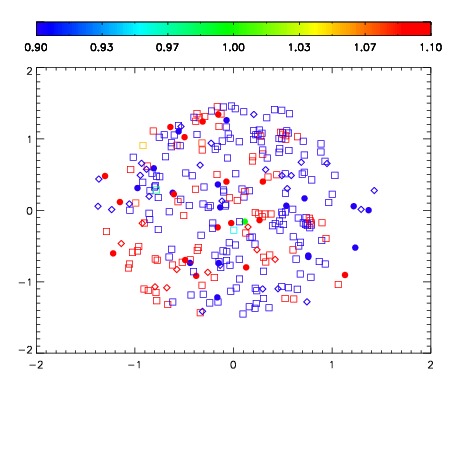
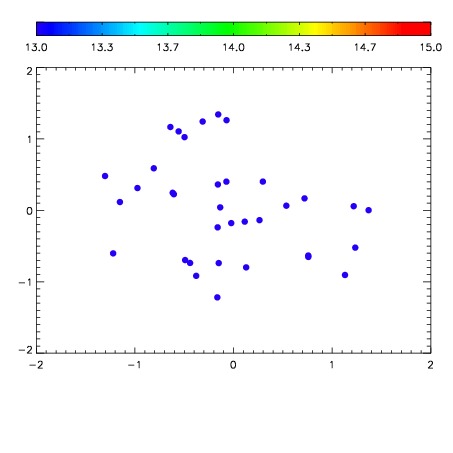

| Frame | Nreads | Zeropoints | Mag plots | Spatial mag deviation | Spatial sky 16325A emission deviations (filled: sky, open: star) | Spatial sky continuum emission | Spatial sky telluric CO2 absorption deviations (filled: H < 10) | |||||||||||||||||||||||
| 0 | 0 |
|
|
|
|
|
|
| IPAIR | NAME | SHIFT | NEWSHIFT | S/N | NAME | SHIFT | NEWSHIFT | S/N |
| 0 | 07260025 | 0.481884 | 0.00000 | 212.115 | 07260023 | 0.00000 | 0.481884 | 184.883 |
| 1 | 07260029 | 0.480450 | 0.00143400 | 223.911 | 07260030 | 0.000611903 | 0.481272 | 230.335 |
| 2 | 07260024 | 0.480800 | 0.00108400 | 190.135 | 07260026 | 0.00187996 | 0.480004 | 144.431 |
| 3 | 07260028 | 0.479645 | 0.00223899 | 119.033 | 07260027 | 0.000330679 | 0.481553 | 122.419 |