| Red | Green | Blue | |
| z | 17.64 | ||
| znorm | Inf | ||
| sky | -Inf | -Inf | -Inf |
| S/N | 9.2 | 17.9 | 20.0 |
| S/N(c) | 0.0 | 0.0 | 0.0 |
| SN(E/C) |
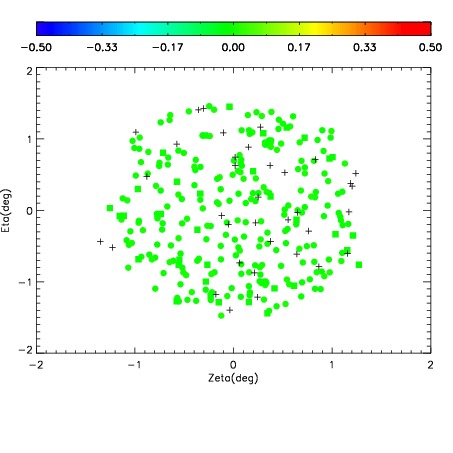
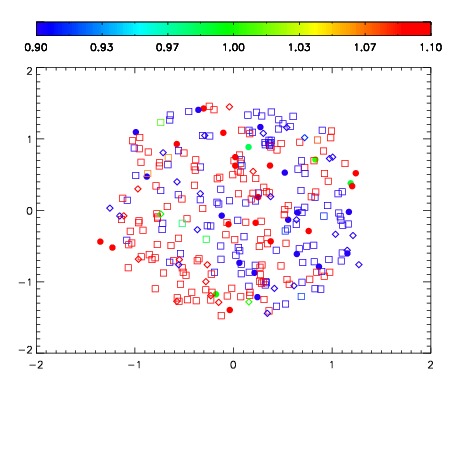
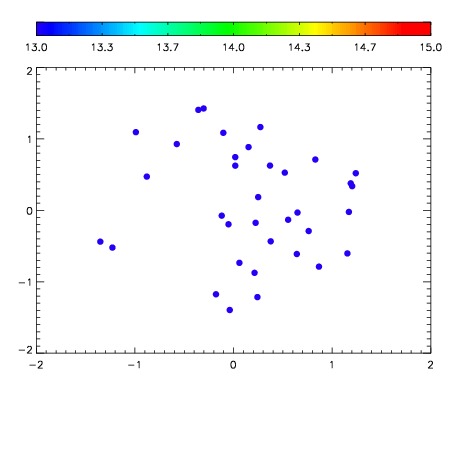

| Frame | Nreads | Zeropoints | Mag plots | Spatial mag deviation | Spatial sky 16325A emission deviations (filled: sky, open: star) | Spatial sky continuum emission | Spatial sky telluric CO2 absorption deviations (filled: H < 10) | |||||||||||||||||||||||
| 0 | 0 |
|
|
|
|
|
|
| IPAIR | NAME | SHIFT | NEWSHIFT | S/N | NAME | SHIFT | NEWSHIFT | S/N |
| 0 | 07290032 | 0.485348 | 0.00000 | 88.9322 | 07290029 | 0.00547481 | 0.479873 | 105.476 |
| 1 | 07290027 | 0.482221 | 0.00312698 | 123.535 | 07290026 | 0.00000 | 0.485348 | 148.984 |
| 2 | 07290028 | 0.482895 | 0.00245300 | 113.990 | 07290033 | 0.00795611 | 0.477392 | 110.126 |
| 3 | 07290031 | 0.485145 | 0.000202984 | 85.9846 | 07290030 | 0.00431512 | 0.481033 | 95.3331 |