| Red | Green | Blue | |
| z | 17.64 | ||
| znorm | Inf | ||
| sky | -Inf | -Inf | -Inf |
| S/N | 23.0 | 41.5 | 46.7 |
| S/N(c) | 0.0 | 0.0 | 0.0 |
| SN(E/C) |
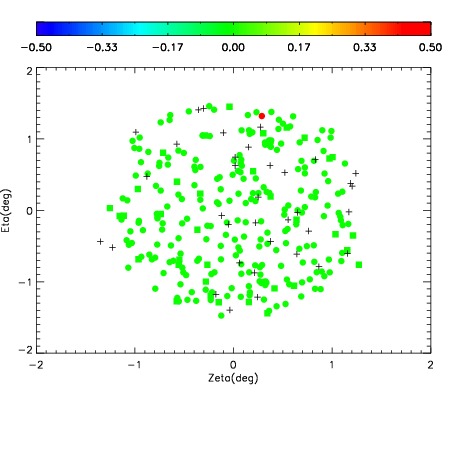
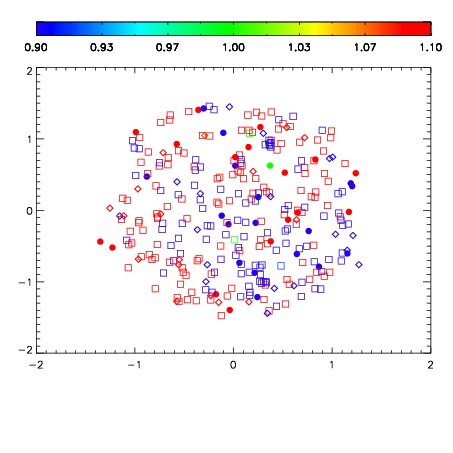
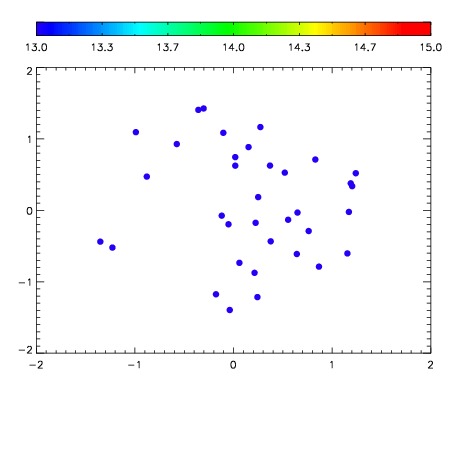

| Frame | Nreads | Zeropoints | Mag plots | Spatial mag deviation | Spatial sky 16325A emission deviations (filled: sky, open: star) | Spatial sky continuum emission | Spatial sky telluric CO2 absorption deviations (filled: H < 10) | |||||||||||||||||||||||
| 0 | 0 |
|
|
|
|
|
|
| IPAIR | NAME | SHIFT | NEWSHIFT | S/N | NAME | SHIFT | NEWSHIFT | S/N |
| 0 | 07500033 | 0.487772 | 0.00000 | 195.569 | 07500034 | 0.00331872 | 0.484453 | 202.378 |
| 1 | 07500029 | 0.484158 | 0.00361398 | 193.591 | 07500031 | 0.000135513 | 0.487636 | 195.812 |
| 2 | 07500032 | 0.486957 | 0.000814974 | 190.021 | 07500027 | 0.00000 | 0.487772 | 190.267 |
| 3 | 07500028 | 0.484491 | 0.00328100 | 189.632 | 07500030 | -0.000454396 | 0.488226 | 186.666 |