| Red | Green | Blue | |
| z | 17.64 | ||
| znorm | Inf | ||
| sky | -Inf | -Inf | -Inf |
| S/N | 17.4 | 33.0 | 36.9 |
| S/N(c) | 0.0 | 0.0 | 0.0 |
| SN(E/C) |
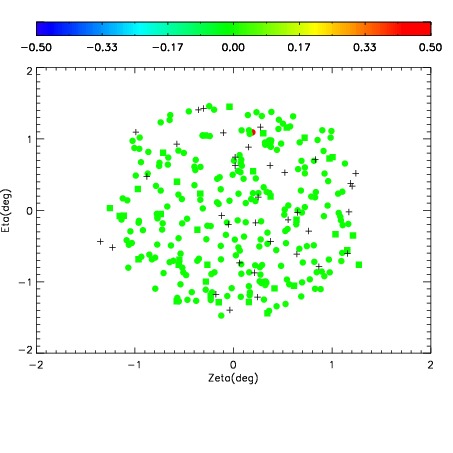
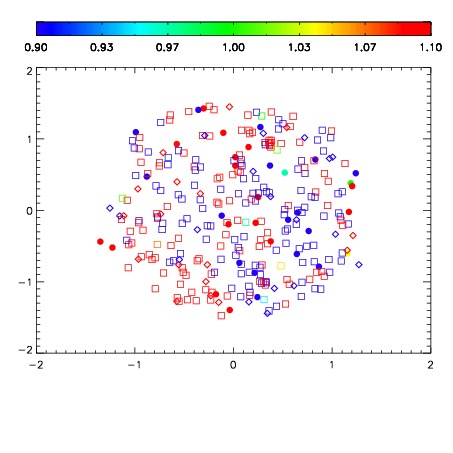
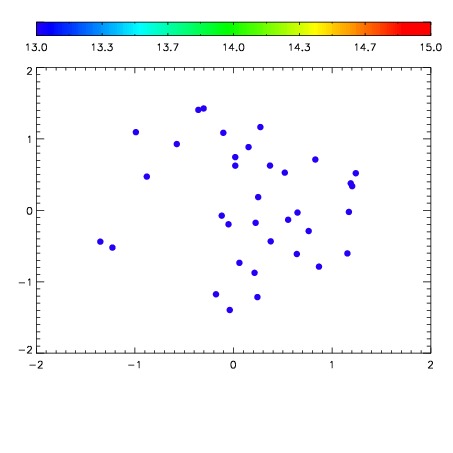

| Frame | Nreads | Zeropoints | Mag plots | Spatial mag deviation | Spatial sky 16325A emission deviations (filled: sky, open: star) | Spatial sky continuum emission | Spatial sky telluric CO2 absorption deviations (filled: H < 10) | |||||||||||||||||||||||
| 0 | 0 |
|
|
|
|
|
|
| IPAIR | NAME | SHIFT | NEWSHIFT | S/N | NAME | SHIFT | NEWSHIFT | S/N |
| 0 | 09970079 | 0.524203 | 0.00000 | 115.149 | 09970080 | 0.00192422 | 0.522279 | 138.148 |
| 1 | 09970083 | 0.519956 | 0.00424701 | 184.973 | 09970084 | 0.00140107 | 0.522802 | 191.924 |
| 2 | 09970082 | 0.520112 | 0.00409102 | 173.099 | 09970077 | 0.00000 | 0.524203 | 187.390 |
| 3 | 09970078 | 0.524127 | 7.59959e-05 | 158.985 | 09970081 | 0.00105594 | 0.523147 | 160.126 |