| Red | Green | Blue | |
| z | 17.64 | ||
| znorm | Inf | ||
| sky | -Inf | -Inf | -Inf |
| S/N | 24.4 | 42.5 | 45.4 |
| S/N(c) | 0.0 | 0.0 | 0.0 |
| SN(E/C) |
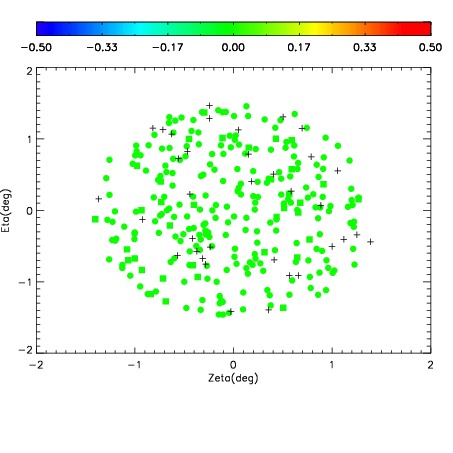

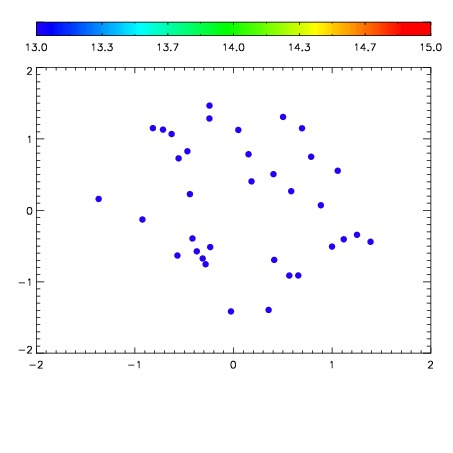

| Frame | Nreads | Zeropoints | Mag plots | Spatial mag deviation | Spatial sky 16325A emission deviations (filled: sky, open: star) | Spatial sky continuum emission | Spatial sky telluric CO2 absorption deviations (filled: H < 10) | |||||||||||||||||||||||
| 0 | 0 |
|
|
|
|
|
|
| IPAIR | NAME | SHIFT | NEWSHIFT | S/N | NAME | SHIFT | NEWSHIFT | S/N |
| 0 | 07030016 | 0.475427 | 0.00000 | 218.771 | 07030017 | 0.00145479 | 0.473972 | 219.689 |
| 1 | 07030015 | 0.474762 | 0.000665009 | 217.506 | 07030013 | 0.00212802 | 0.473299 | 216.907 |
| 2 | 07030012 | 0.473595 | 0.00183201 | 212.419 | 07030014 | 0.00158452 | 0.473842 | 208.109 |
| 3 | 07030011 | 0.473457 | 0.00196999 | 204.685 | 07030010 | 0.00000 | 0.475427 | 194.996 |