| Red | Green | Blue | |
| z | 17.64 | ||
| znorm | Inf | ||
| sky | -NaN | -Inf | -Inf |
| S/N | 24.5 | 42.9 | 47.3 |
| S/N(c) | 0.0 | 0.0 | 0.0 |
| SN(E/C) |
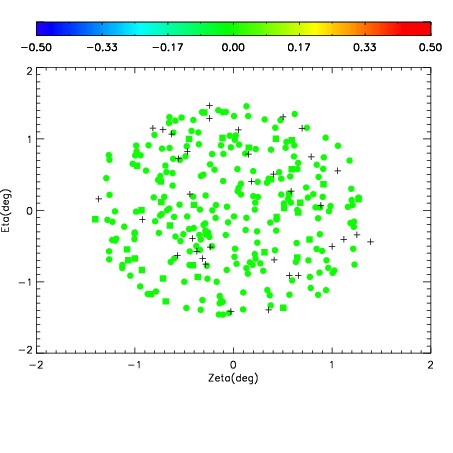
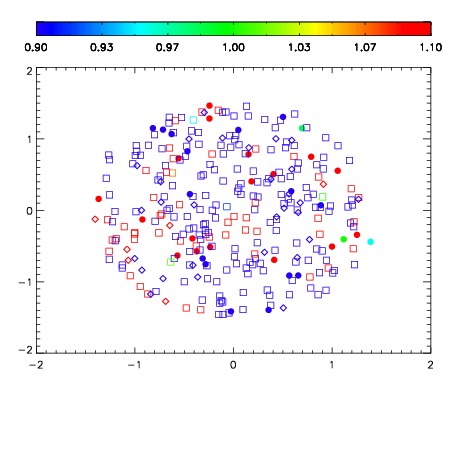
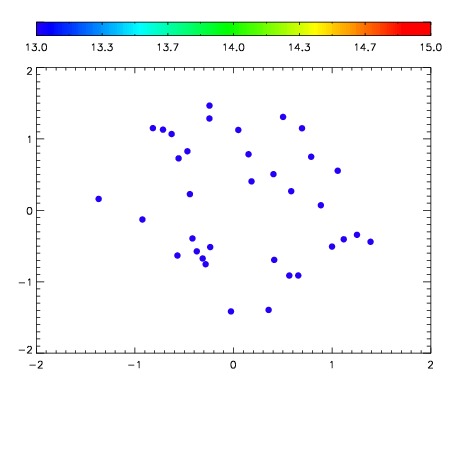

| Frame | Nreads | Zeropoints | Mag plots | Spatial mag deviation | Spatial sky 16325A emission deviations (filled: sky, open: star) | Spatial sky continuum emission | Spatial sky telluric CO2 absorption deviations (filled: H < 10) | |||||||||||||||||||||||
| 0 | 0 |
|
|
|
|
|
|
| IPAIR | NAME | SHIFT | NEWSHIFT | S/N | NAME | SHIFT | NEWSHIFT | S/N |
| 0 | 07280028 | 0.486902 | 0.00000 | 231.206 | 07280026 | 0.00000 | 0.486902 | 229.734 |
| 1 | 07280027 | 0.486494 | 0.000407994 | 230.980 | 07280029 | 0.00311726 | 0.483785 | 229.417 |
| 2 | 07280031 | 0.485030 | 0.00187200 | 225.843 | 07280033 | 0.00404999 | 0.482852 | 225.703 |
| 3 | 07280032 | 0.485931 | 0.000970989 | 222.454 | 07280030 | 0.00321706 | 0.483685 | 218.411 |