| Red | Green | Blue | |
| z | 17.64 | ||
| znorm | Inf | ||
| sky | -Inf | -Inf | -Inf |
| S/N | 27.5 | 48.6 | 51.1 |
| S/N(c) | 0.0 | 0.0 | 0.0 |
| SN(E/C) |
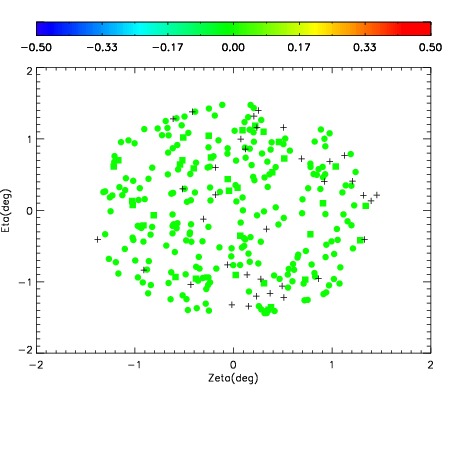
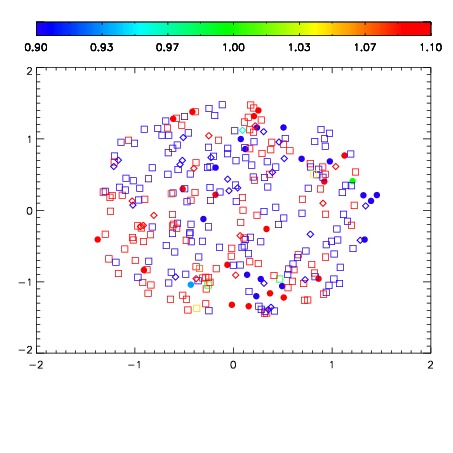
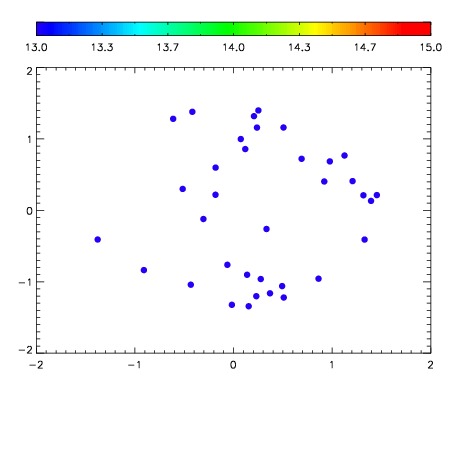

| Frame | Nreads | Zeropoints | Mag plots | Spatial mag deviation | Spatial sky 16325A emission deviations (filled: sky, open: star) | Spatial sky continuum emission | Spatial sky telluric CO2 absorption deviations (filled: H < 10) | |||||||||||||||||||||||
| 0 | 0 |
|
|
|
|
|
|
| IPAIR | NAME | SHIFT | NEWSHIFT | S/N | NAME | SHIFT | NEWSHIFT | S/N |
| 0 | 06950055 | 0.492028 | 0.00000 | 226.617 | 06950053 | -0.00132028 | 0.493348 | 220.791 |
| 1 | 06950051 | 0.492018 | 9.98378e-06 | 227.896 | 06950052 | 0.000853364 | 0.491175 | 226.384 |
| 2 | 06950050 | 0.491872 | 0.000155985 | 220.380 | 06950056 | -1.02558e-05 | 0.492038 | 219.013 |
| 3 | 06950054 | 0.491724 | 0.000303984 | 217.463 | 06950049 | 0.00000 | 0.492028 | 211.674 |