| Red | Green | Blue | |
| z | 17.64 | ||
| znorm | Inf | ||
| sky | -Inf | -Inf | -Inf |
| S/N | 29.3 | 49.7 | 53.5 |
| S/N(c) | 0.0 | 0.0 | 0.0 |
| SN(E/C) |
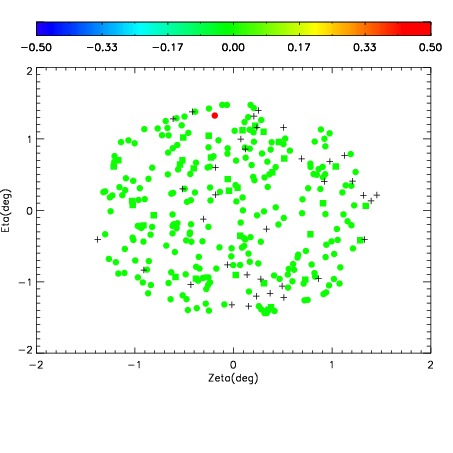
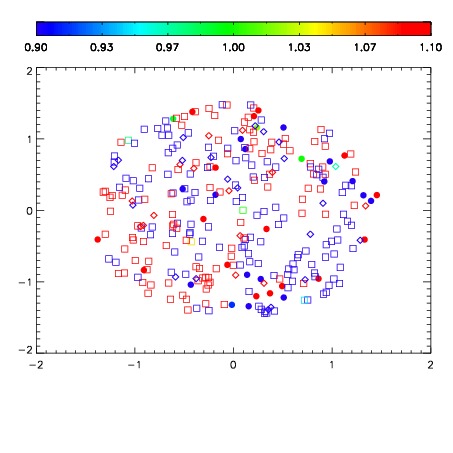
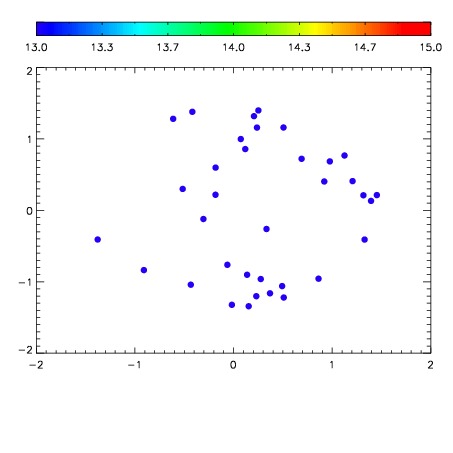

| Frame | Nreads | Zeropoints | Mag plots | Spatial mag deviation | Spatial sky 16325A emission deviations (filled: sky, open: star) | Spatial sky continuum emission | Spatial sky telluric CO2 absorption deviations (filled: H < 10) | |||||||||||||||||||||||
| 0 | 0 |
|
|
|
|
|
|
| IPAIR | NAME | SHIFT | NEWSHIFT | S/N | NAME | SHIFT | NEWSHIFT | S/N |
| 0 | 06990059 | 0.483005 | 0.00000 | 240.727 | 06990060 | 0.000114102 | 0.482891 | 243.461 |
| 1 | 06990058 | 0.478353 | 0.00465199 | 238.241 | 06990057 | -0.00113768 | 0.484143 | 235.888 |
| 2 | 06990054 | 0.478360 | 0.00464499 | 233.336 | 06990056 | 0.000325282 | 0.482680 | 231.065 |
| 3 | 06990055 | 0.482672 | 0.000332981 | 233.311 | 06990053 | 0.00000 | 0.483005 | 230.198 |