| Red | Green | Blue | |
| z | 17.64 | ||
| znorm | Inf | ||
| sky | -Inf | -Inf | -Inf |
| S/N | 25.0 | 43.1 | 46.7 |
| S/N(c) | 0.0 | 0.0 | 0.0 |
| SN(E/C) |
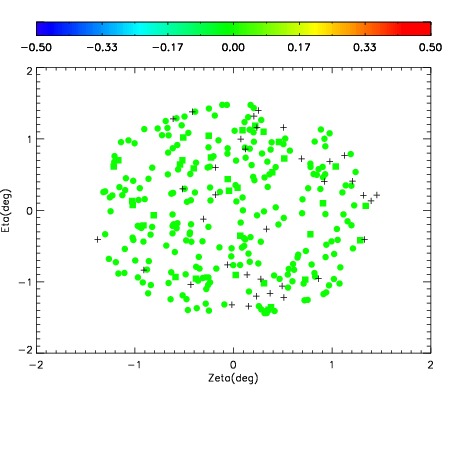
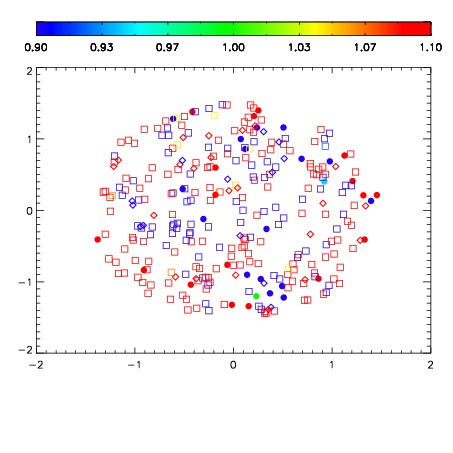
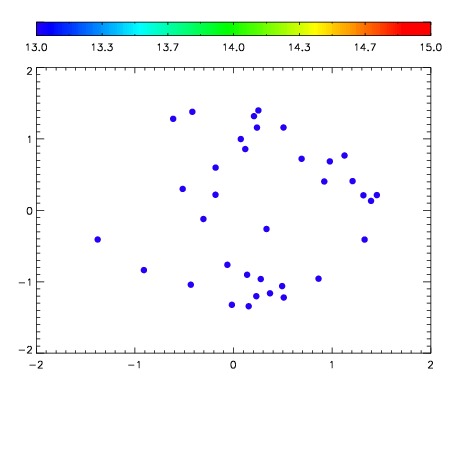

| Frame | Nreads | Zeropoints | Mag plots | Spatial mag deviation | Spatial sky 16325A emission deviations (filled: sky, open: star) | Spatial sky continuum emission | Spatial sky telluric CO2 absorption deviations (filled: H < 10) | |||||||||||||||||||||||
| 0 | 0 |
|
|
|
|
|
|
| IPAIR | NAME | SHIFT | NEWSHIFT | S/N | NAME | SHIFT | NEWSHIFT | S/N |
| 0 | 07510012 | 0.471708 | 0.00000 | 219.449 | 07510014 | 0.000662879 | 0.471045 | 223.412 |
| 1 | 07510015 | 0.470569 | 0.00113899 | 217.656 | 07510017 | 0.00371031 | 0.467998 | 217.092 |
| 2 | 07510011 | 0.471274 | 0.000434011 | 217.427 | 07510010 | 0.00000 | 0.471708 | 216.232 |
| 3 | 07510016 | 0.470905 | 0.000802994 | 210.123 | 07510013 | 0.00103532 | 0.470673 | 213.807 |