| Red | Green | Blue | |
| z | 17.64 | ||
| znorm | Inf | ||
| sky | -Inf | -Inf | -Inf |
| S/N | 26.1 | 46.0 | 50.4 |
| S/N(c) | 0.0 | 0.0 | 0.0 |
| SN(E/C) |
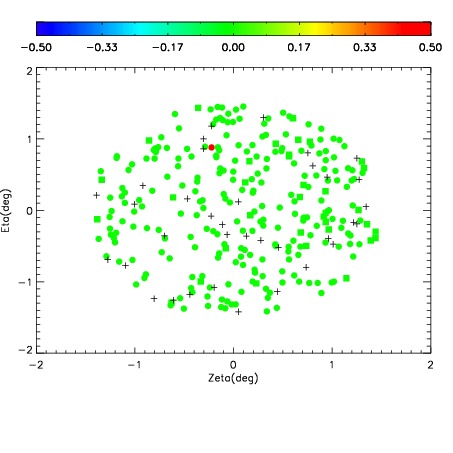
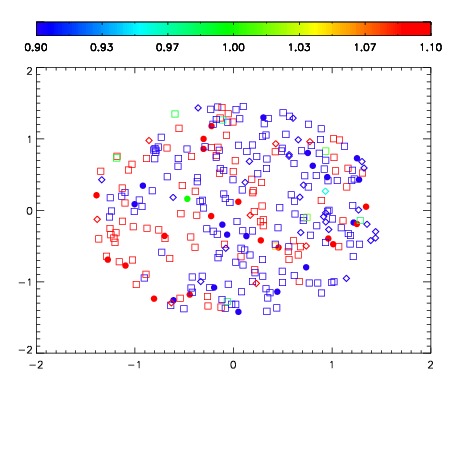
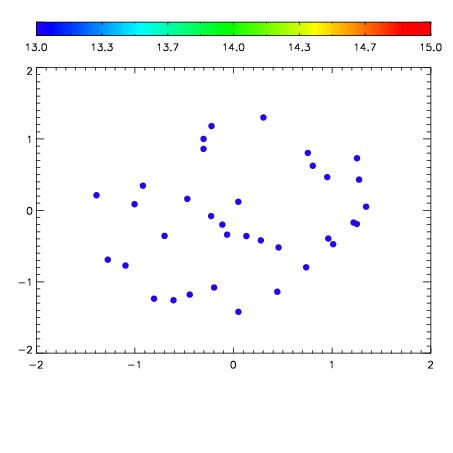

| Frame | Nreads | Zeropoints | Mag plots | Spatial mag deviation | Spatial sky 16325A emission deviations (filled: sky, open: star) | Spatial sky continuum emission | Spatial sky telluric CO2 absorption deviations (filled: H < 10) | |||||||||||||||||||||||
| 0 | 0 |
|
|
|
|
|
|
| IPAIR | NAME | SHIFT | NEWSHIFT | S/N | NAME | SHIFT | NEWSHIFT | S/N |
| 0 | 06940056 | 0.501004 | 0.00000 | 195.875 | 06940057 | 0.000914850 | 0.500089 | 195.478 |
| 1 | 06940052 | 0.497361 | 0.00364298 | 191.594 | 06940054 | 0.00409578 | 0.496908 | 189.494 |
| 2 | 06940055 | 0.500780 | 0.000223994 | 190.861 | 06940053 | -8.56042e-05 | 0.501090 | 188.709 |
| 3 | 06940051 | 0.496805 | 0.00419897 | 186.264 | 06940050 | 0.00000 | 0.501004 | 186.453 |