| Red | Green | Blue | |
| z | 17.64 | ||
| znorm | Inf | ||
| sky | -Inf | -NaN | -Inf |
| S/N | 27.1 | 47.1 | 50.7 |
| S/N(c) | 0.0 | 0.0 | 0.0 |
| SN(E/C) |
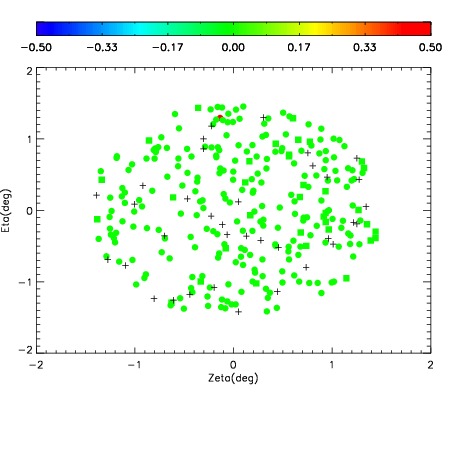
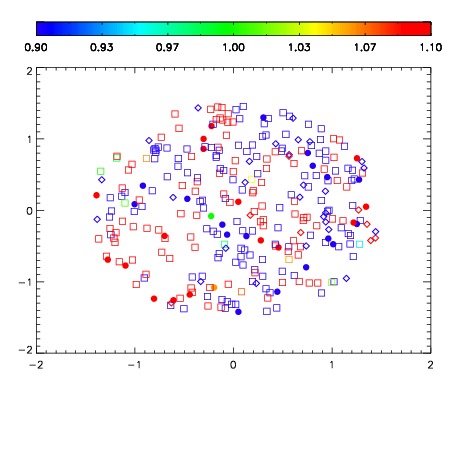
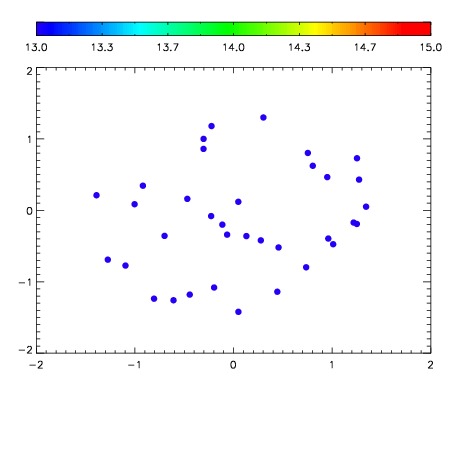

| Frame | Nreads | Zeropoints | Mag plots | Spatial mag deviation | Spatial sky 16325A emission deviations (filled: sky, open: star) | Spatial sky continuum emission | Spatial sky telluric CO2 absorption deviations (filled: H < 10) | |||||||||||||||||||||||
| 0 | 0 |
|
|
|
|
|
|
| IPAIR | NAME | SHIFT | NEWSHIFT | S/N | NAME | SHIFT | NEWSHIFT | S/N |
| 0 | 07000056 | 0.482136 | 0.00000 | 198.797 | 07000053 | 0.000164357 | 0.481972 | 208.424 |
| 1 | 07000051 | 0.480394 | 0.00174201 | 204.054 | 07000050 | 0.00000 | 0.482136 | 208.954 |
| 2 | 07000055 | 0.481170 | 0.000966012 | 196.083 | 07000057 | -0.000509567 | 0.482646 | 208.051 |
| 3 | 07000052 | 0.481970 | 0.000165999 | 192.255 | 07000054 | 0.000441158 | 0.481695 | 192.546 |