| Red | Green | Blue | |
| z | 17.64 | ||
| znorm | Inf | ||
| sky | -Inf | -Inf | -Inf |
| S/N | 30.8 | 53.9 | 57.4 |
| S/N(c) | 0.0 | 0.0 | 0.0 |
| SN(E/C) |
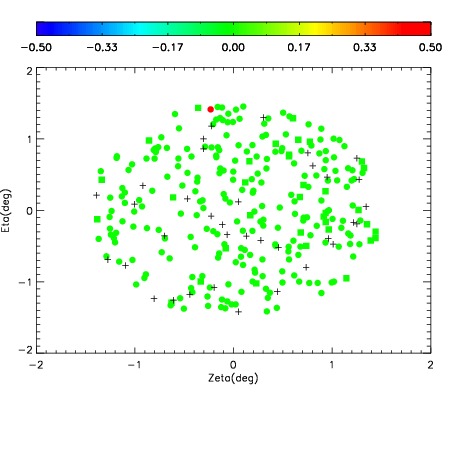
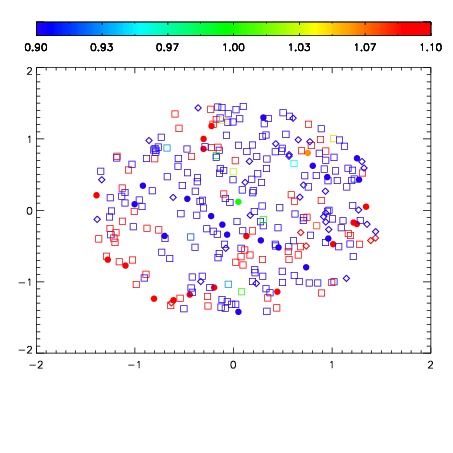
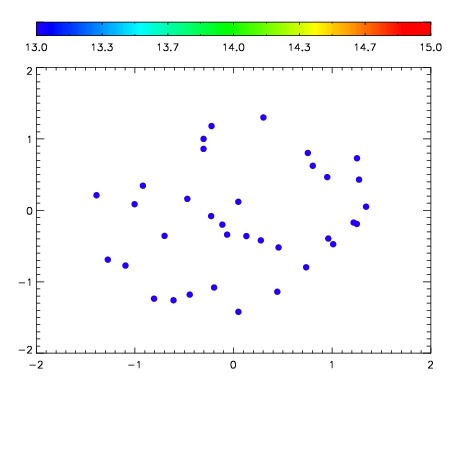

| Frame | Nreads | Zeropoints | Mag plots | Spatial mag deviation | Spatial sky 16325A emission deviations (filled: sky, open: star) | Spatial sky continuum emission | Spatial sky telluric CO2 absorption deviations (filled: H < 10) | |||||||||||||||||||||||
| 0 | 0 |
|
|
|
|
|
|
| IPAIR | NAME | SHIFT | NEWSHIFT | S/N | NAME | SHIFT | NEWSHIFT | S/N |
| 0 | 07260040 | 0.479308 | 0.00000 | 197.736 | 07260041 | 0.00265402 | 0.476654 | 197.696 |
| 1 | 07260047 | 0.477537 | 0.00177100 | 197.831 | 07260042 | 0.00352873 | 0.475779 | 198.176 |
| 2 | 07260043 | 0.476740 | 0.00256801 | 197.519 | 07260046 | 0.00228489 | 0.477023 | 195.022 |
| 3 | 07260044 | 0.477632 | 0.00167602 | 196.006 | 07260045 | 0.00815447 | 0.471154 | 194.535 |
| 4 | 07260039 | 0.478701 | 0.000607014 | 192.751 | 07260038 | 0.00000 | 0.479308 | 188.397 |
| 5 | 07260048 | 0.477688 | 0.00161999 | 183.248 | 07260049 | 0.00329336 | 0.476015 | 187.723 |