| Red | Green | Blue | |
| z | 17.64 | ||
| znorm | Inf | ||
| sky | -Inf | -Inf | -Inf |
| S/N | 24.8 | 40.5 | 47.7 |
| S/N(c) | 0.0 | 0.0 | 0.0 |
| SN(E/C) |
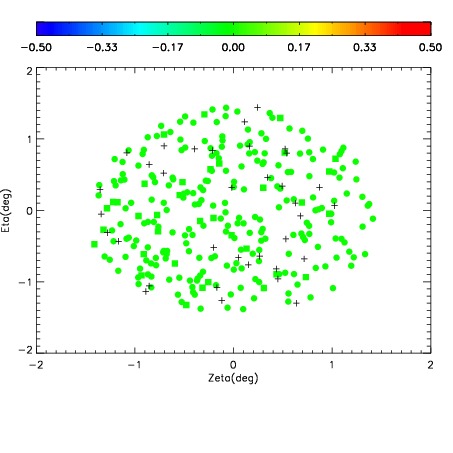
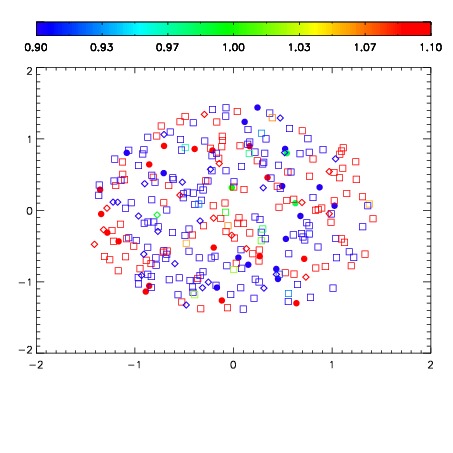
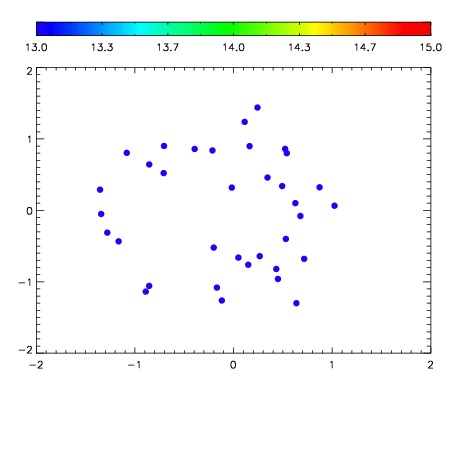

| Frame | Nreads | Zeropoints | Mag plots | Spatial mag deviation | Spatial sky 16325A emission deviations (filled: sky, open: star) | Spatial sky continuum emission | Spatial sky telluric CO2 absorption deviations (filled: H < 10) | |||||||||||||||||||||||
| 0 | 0 |
|
|
|
|
|
|
| IPAIR | NAME | SHIFT | NEWSHIFT | S/N | NAME | SHIFT | NEWSHIFT | S/N |
| 0 | 07000067 | 0.482344 | 0.00000 | 214.867 | 07000061 | 0.00000 | 0.482344 | 213.780 |
| 1 | 07000063 | 0.481732 | 0.000611991 | 214.279 | 07000064 | 0.000502187 | 0.481842 | 212.238 |
| 2 | 07000062 | 0.480751 | 0.00159299 | 210.947 | 07000065 | -0.00100698 | 0.483351 | 200.680 |
| 3 | 07000066 | 0.480880 | 0.00146401 | 210.703 | 07000068 | 0.00229201 | 0.480052 | 198.768 |