| Red | Green | Blue | |
| z | 17.64 | ||
| znorm | Inf | ||
| sky | -NaN | -Inf | -Inf |
| S/N | 23.2 | 39.9 | 45.6 |
| S/N(c) | 0.0 | 0.0 | 0.0 |
| SN(E/C) |
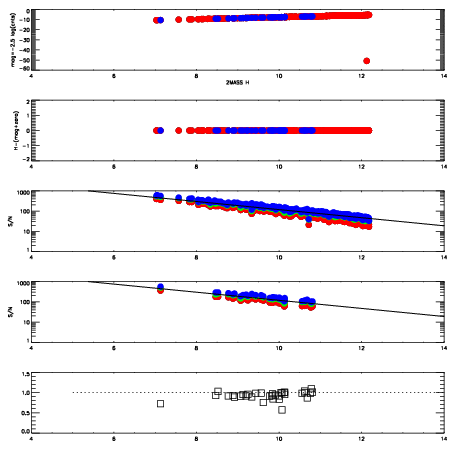
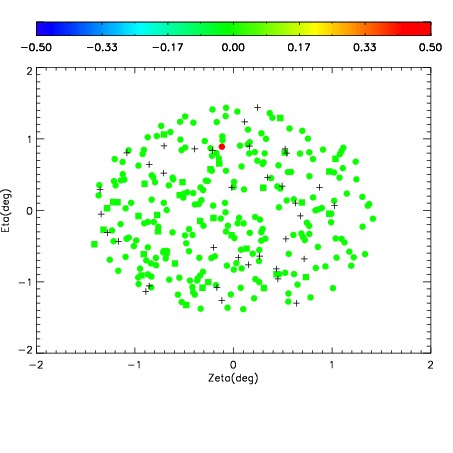
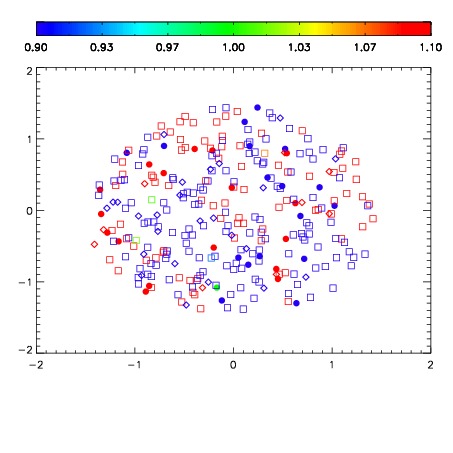
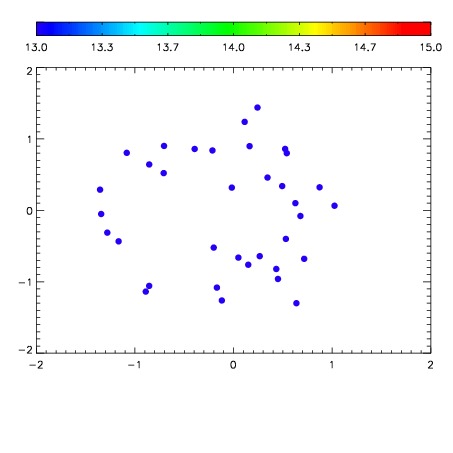

| Frame | Nreads | Zeropoints | Mag plots | Spatial mag deviation | Spatial sky 16325A emission deviations (filled: sky, open: star) | Spatial sky continuum emission | Spatial sky telluric CO2 absorption deviations (filled: H < 10) | |||||||||||||||||||||||
| 0 | 0 |
|
|
|
|
|
|
| IPAIR | NAME | SHIFT | NEWSHIFT | S/N | NAME | SHIFT | NEWSHIFT | S/N |
| 0 | 07230039 | 0.478039 | 0.00000 | 224.716 | 07230041 | 0.00214375 | 0.475895 | 222.127 |
| 1 | 07230042 | 0.477325 | 0.000714004 | 225.057 | 07230037 | 0.00000 | 0.478039 | 222.217 |
| 2 | 07230038 | 0.477838 | 0.000200987 | 221.088 | 07230044 | 0.00366111 | 0.474378 | 219.583 |
| 3 | 07230043 | 0.477586 | 0.000452995 | 216.447 | 07230040 | 0.00305783 | 0.474981 | 197.922 |