| Red | Green | Blue | |
| z | 17.64 | ||
| znorm | Inf | ||
| sky | -Inf | -Inf | -Inf |
| S/N | 20.5 | 36.3 | 40.5 |
| S/N(c) | 0.0 | 0.0 | 0.0 |
| SN(E/C) |
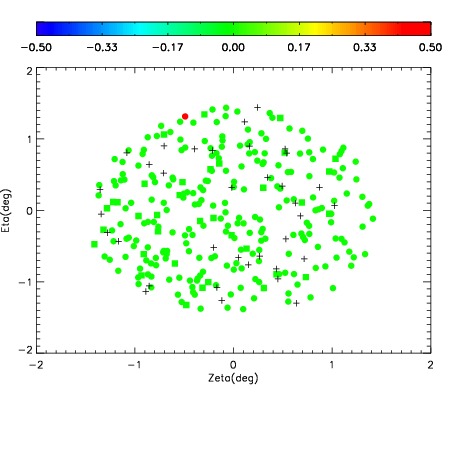
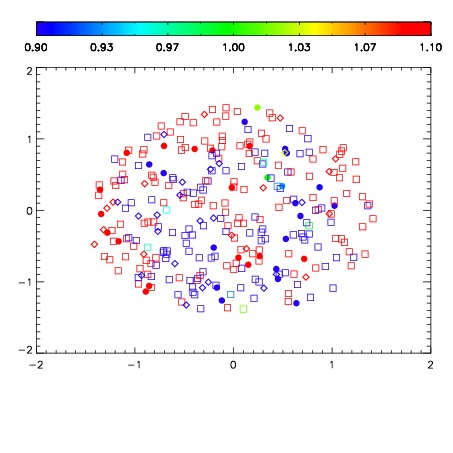
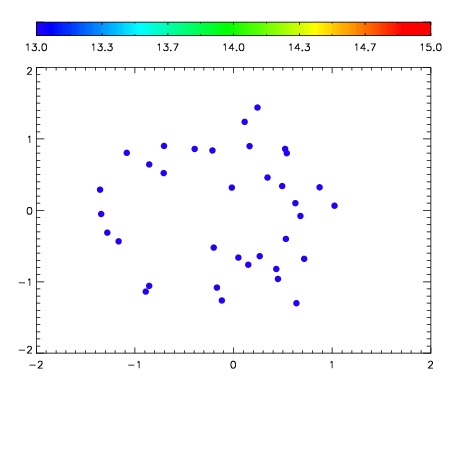

| Frame | Nreads | Zeropoints | Mag plots | Spatial mag deviation | Spatial sky 16325A emission deviations (filled: sky, open: star) | Spatial sky continuum emission | Spatial sky telluric CO2 absorption deviations (filled: H < 10) | |||||||||||||||||||||||
| 0 | 0 |
|
|
|
|
|
|
| IPAIR | NAME | SHIFT | NEWSHIFT | S/N | NAME | SHIFT | NEWSHIFT | S/N |
| 0 | 07510027 | 0.465585 | 0.00000 | 190.357 | 07510029 | -0.00210094 | 0.467686 | 201.697 |
| 1 | 07510026 | 0.465519 | 6.59823e-05 | 199.397 | 07510025 | 0.00000 | 0.465585 | 204.961 |
| 2 | 07510030 | 0.464102 | 0.00148299 | 177.177 | 07510028 | 0.000298036 | 0.465287 | 195.982 |
| 3 | 07510031 | 0.465222 | 0.000362992 | 168.745 | 07510032 | -0.00152820 | 0.467113 | 186.158 |