| Red | Green | Blue | |
| z | 17.64 | ||
| znorm | Inf | ||
| sky | -Inf | -Inf | -Inf |
| S/N | 27.2 | 47.6 | 52.5 |
| S/N(c) | 0.0 | 0.0 | 0.0 |
| SN(E/C) |


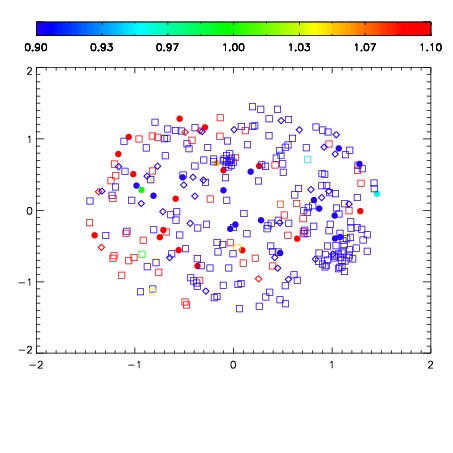


| Frame | Nreads | Zeropoints | Mag plots | Spatial mag deviation | Spatial sky 16325A emission deviations (filled: sky, open: star) | Spatial sky continuum emission | Spatial sky telluric CO2 absorption deviations (filled: H < 10) | |||||||||||||||||||||||
| 0 | 0 |
|
|
|
|
|
|
| IPAIR | NAME | SHIFT | NEWSHIFT | S/N | NAME | SHIFT | NEWSHIFT | S/N |
| 0 | 07280043 | 0.488816 | 0.00000 | 205.976 | 07280044 | 0.00141606 | 0.487400 | 198.378 |
| 1 | 07280038 | 0.482136 | 0.00667998 | 210.587 | 07280040 | 0.000402565 | 0.488413 | 209.646 |
| 2 | 07280039 | 0.482541 | 0.00627500 | 209.330 | 07280041 | 0.000143823 | 0.488672 | 209.343 |
| 3 | 07280042 | 0.488671 | 0.000144988 | 207.718 | 07280037 | 0.00000 | 0.488816 | 207.238 |