| Red | Green | Blue | |
| z | 17.64 | ||
| znorm | Inf | ||
| sky | -NaN | -Inf | -Inf |
| S/N | 24.8 | 44.4 | 46.7 |
| S/N(c) | 0.0 | 0.0 | 0.0 |
| SN(E/C) |
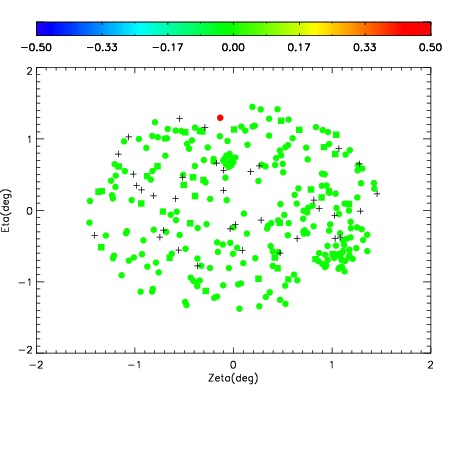
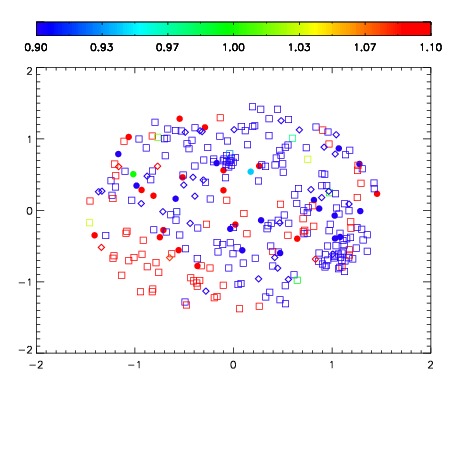
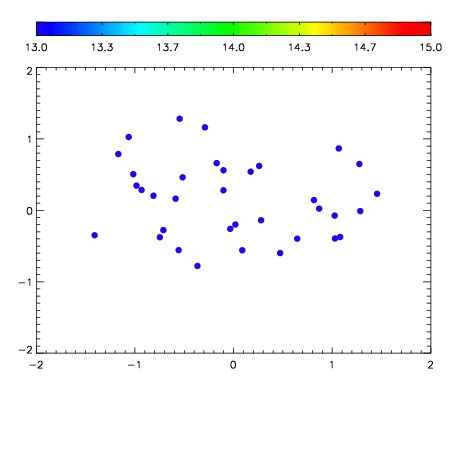

| Frame | Nreads | Zeropoints | Mag plots | Spatial mag deviation | Spatial sky 16325A emission deviations (filled: sky, open: star) | Spatial sky continuum emission | Spatial sky telluric CO2 absorption deviations (filled: H < 10) | |||||||||||||||||||||||
| 0 | 0 |
|
|
|
|
|
|
| IPAIR | NAME | SHIFT | NEWSHIFT | S/N | NAME | SHIFT | NEWSHIFT | S/N |
| 0 | 10230079 | 0.500614 | 0.00000 | 206.706 | 10230077 | 0.00160455 | 0.499009 | 206.921 |
| 1 | 10230074 | 0.500287 | 0.000326991 | 205.887 | 10230076 | 0.00195724 | 0.498657 | 206.516 |
| 2 | 10230075 | 0.500138 | 0.000476003 | 204.297 | 10230073 | 0.00000 | 0.500614 | 203.407 |
| 3 | 10230078 | 0.500563 | 5.09620e-05 | 203.437 | 10230080 | 0.00301445 | 0.497600 | 196.999 |