| Red | Green | Blue | |
| z | 17.64 | ||
| znorm | Inf | ||
| sky | -Inf | -NaN | -Inf |
| S/N | 27.4 | 45.9 | 54.4 |
| S/N(c) | 0.0 | 0.0 | 0.0 |
| SN(E/C) |

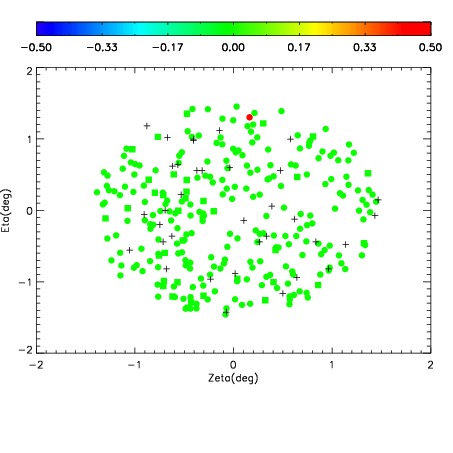
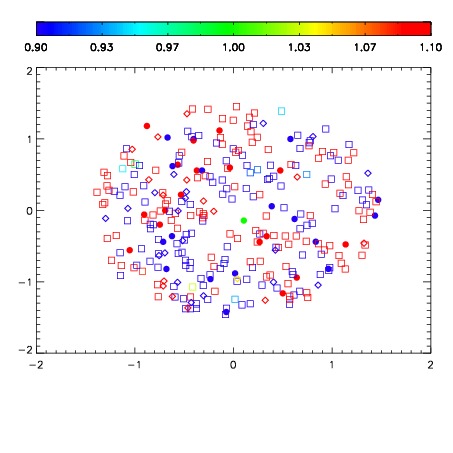
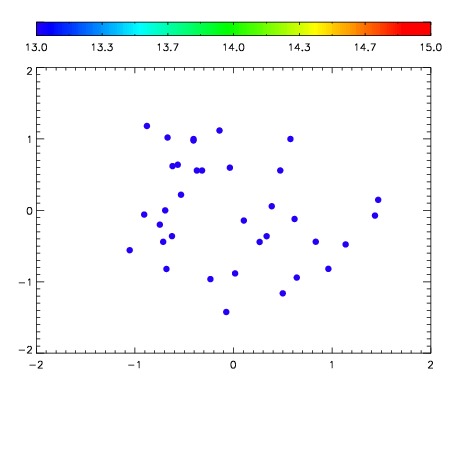

| Frame | Nreads | Zeropoints | Mag plots | Spatial mag deviation | Spatial sky 16325A emission deviations (filled: sky, open: star) | Spatial sky continuum emission | Spatial sky telluric CO2 absorption deviations (filled: H < 10) | |||||||||||||||||||||||
| 0 | 0 |
|
|
|
|
|
|
| IPAIR | NAME | SHIFT | NEWSHIFT | S/N | NAME | SHIFT | NEWSHIFT | S/N |
| 0 | 06950062 | 0.495554 | 0.00000 | 183.248 | 06950064 | 0.00223860 | 0.493315 | 183.686 |
| 1 | 06950066 | 0.491766 | 0.00378799 | 180.229 | 06950067 | 0.000253900 | 0.495300 | 181.543 |
| 2 | 06950061 | 0.495227 | 0.000326991 | 179.466 | 06950063 | 0.00367297 | 0.491881 | 180.225 |
| 3 | 06950065 | 0.491502 | 0.00405201 | 178.239 | 06950060 | 0.00000 | 0.495554 | 178.989 |