| Red | Green | Blue | |
| z | 17.64 | ||
| znorm | Inf | ||
| sky | -Inf | -Inf | -Inf |
| S/N | 30.0 | 49.3 | 56.1 |
| S/N(c) | 0.0 | 0.0 | 0.0 |
| SN(E/C) |
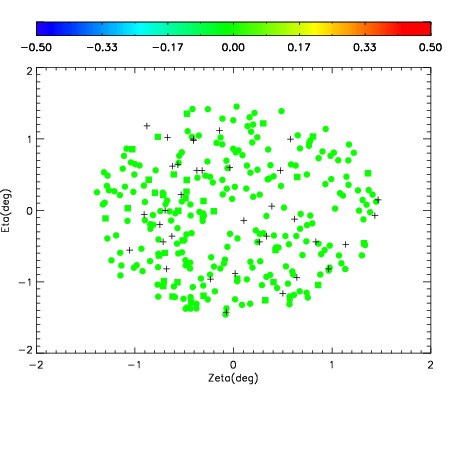
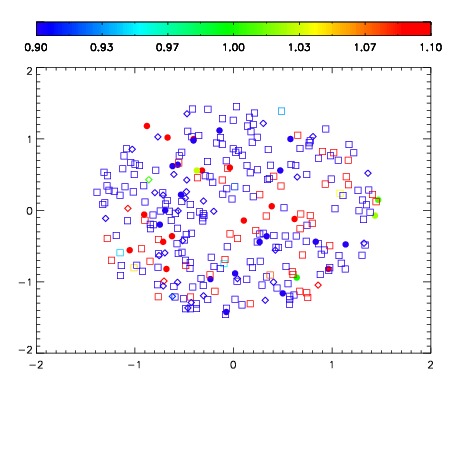
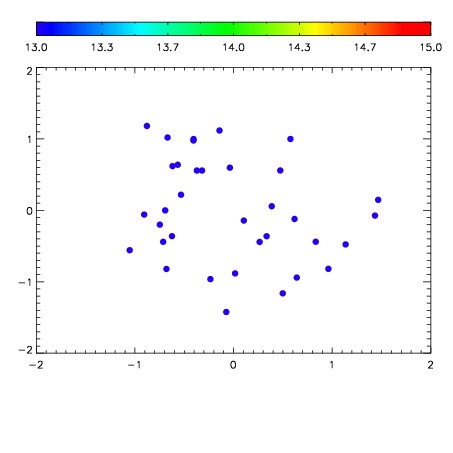

| Frame | Nreads | Zeropoints | Mag plots | Spatial mag deviation | Spatial sky 16325A emission deviations (filled: sky, open: star) | Spatial sky continuum emission | Spatial sky telluric CO2 absorption deviations (filled: H < 10) | |||||||||||||||||||||||
| 0 | 0 |
|
|
|
|
|
|
| IPAIR | NAME | SHIFT | NEWSHIFT | S/N | NAME | SHIFT | NEWSHIFT | S/N |
| 0 | 10220087 | 0.496957 | 0.00000 | 183.097 | 10220092 | 0.00325599 | 0.493701 | 183.498 |
| 1 | 10220091 | 0.495487 | 0.00147000 | 190.548 | 10220089 | 0.00233119 | 0.494626 | 190.498 |
| 2 | 10220090 | 0.495323 | 0.00163400 | 189.576 | 10220088 | 0.00207991 | 0.494877 | 187.373 |
| 3 | 10220086 | 0.496383 | 0.000573993 | 187.581 | 10220085 | 0.00000 | 0.496957 | 186.181 |