| Red | Green | Blue | |
| z | 17.64 | ||
| znorm | Inf | ||
| sky | -Inf | -Inf | -Inf |
| S/N | 30.2 | 50.9 | 55.3 |
| S/N(c) | 0.0 | 0.0 | 0.0 |
| SN(E/C) |
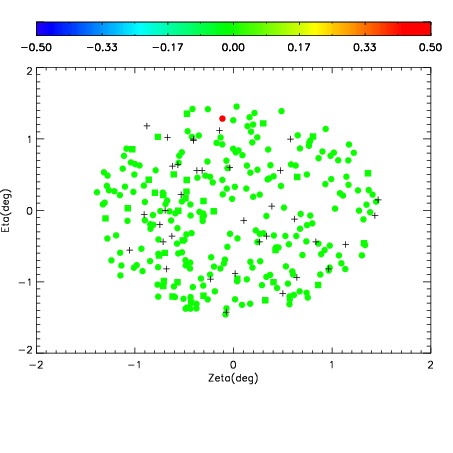
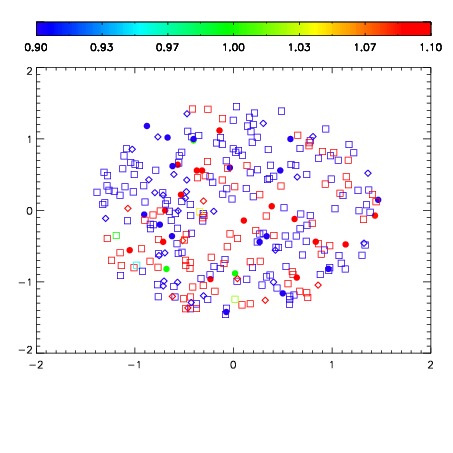
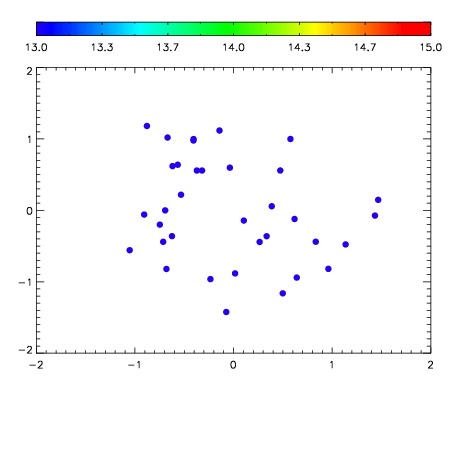

| Frame | Nreads | Zeropoints | Mag plots | Spatial mag deviation | Spatial sky 16325A emission deviations (filled: sky, open: star) | Spatial sky continuum emission | Spatial sky telluric CO2 absorption deviations (filled: H < 10) | |||||||||||||||||||||||
| 0 | 0 |
|
|
|
|
|
|
| IPAIR | NAME | SHIFT | NEWSHIFT | S/N | NAME | SHIFT | NEWSHIFT | S/N |
| 0 | 10290032 | 0.488528 | 0.00000 | 204.584 | 10290037 | -0.00146522 | 0.489993 | 213.327 |
| 1 | 10290036 | 0.487269 | 0.00125900 | 211.100 | 10290033 | 0.000181719 | 0.488346 | 215.892 |
| 2 | 10290035 | 0.487166 | 0.00136203 | 207.345 | 10290034 | 0.000826948 | 0.487701 | 214.688 |
| 3 | 10290031 | 0.488372 | 0.000156015 | 196.766 | 10290030 | 0.00000 | 0.488528 | 172.549 |