| Red | Green | Blue | |
| z | 17.64 | ||
| znorm | Inf | ||
| sky | -Inf | -Inf | -Inf |
| S/N | 28.2 | 46.2 | 53.9 |
| S/N(c) | 0.0 | 0.0 | 0.0 |
| SN(E/C) |
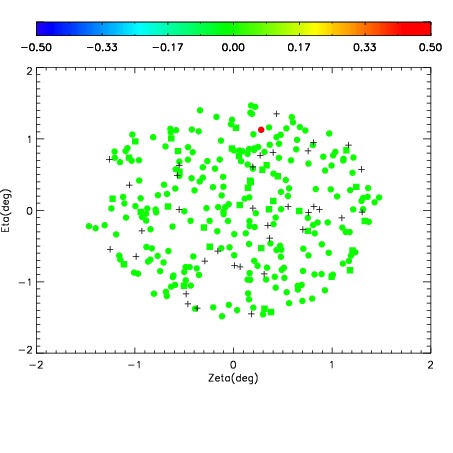

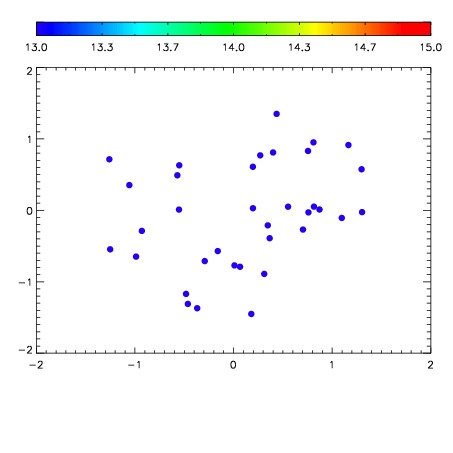

| Frame | Nreads | Zeropoints | Mag plots | Spatial mag deviation | Spatial sky 16325A emission deviations (filled: sky, open: star) | Spatial sky continuum emission | Spatial sky telluric CO2 absorption deviations (filled: H < 10) | |||||||||||||||||||||||
| 0 | 0 |
|
|
|
|
|
|
| IPAIR | NAME | SHIFT | NEWSHIFT | S/N | NAME | SHIFT | NEWSHIFT | S/N |
| 0 | 06940066 | 0.494369 | 0.00000 | 233.155 | 06940061 | 0.00000 | 0.494369 | 223.131 |
| 1 | 06940063 | 0.492741 | 0.00162801 | 243.860 | 06940065 | 0.000236252 | 0.494133 | 234.391 |
| 2 | 06940062 | 0.493275 | 0.00109401 | 239.552 | 06940064 | 0.000909207 | 0.493460 | 232.858 |
| 3 | 06940067 | 0.494361 | 7.98702e-06 | 237.558 | 06940068 | -0.00192770 | 0.496297 | 226.623 |