| Red | Green | Blue | |
| z | 17.64 | ||
| znorm | Inf | ||
| sky | -Inf | -Inf | -Inf |
| S/N | 23.1 | 39.2 | 41.4 |
| S/N(c) | 0.0 | 0.0 | 0.0 |
| SN(E/C) |
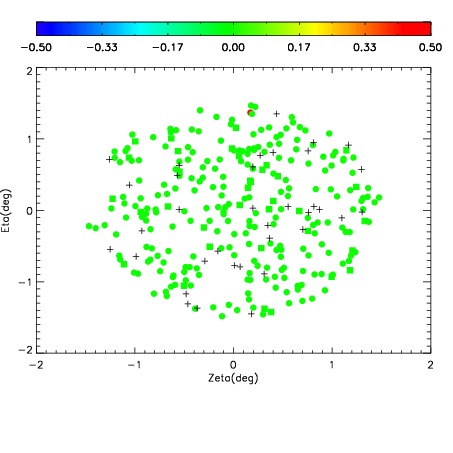
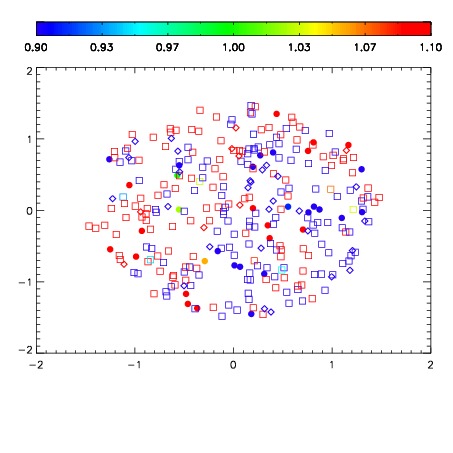
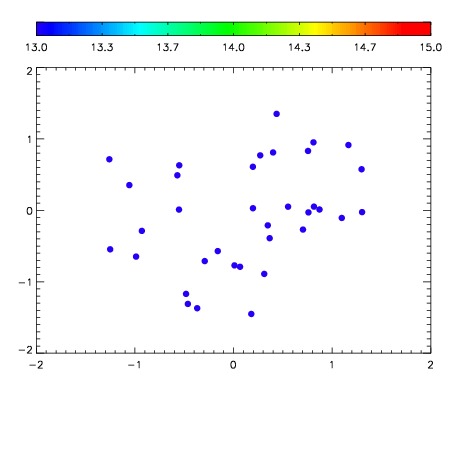

| Frame | Nreads | Zeropoints | Mag plots | Spatial mag deviation | Spatial sky 16325A emission deviations (filled: sky, open: star) | Spatial sky continuum emission | Spatial sky telluric CO2 absorption deviations (filled: H < 10) | |||||||||||||||||||||||
| 0 | 0 |
|
|
|
|
|
|
| IPAIR | NAME | SHIFT | NEWSHIFT | S/N | NAME | SHIFT | NEWSHIFT | S/N |
| 0 | 07040013 | 0.469356 | 0.00000 | 199.368 | 07040014 | 0.00127776 | 0.468078 | 185.498 |
| 1 | 07040017 | 0.467315 | 0.00204101 | 212.278 | 07040018 | 0.000805717 | 0.468550 | 217.468 |
| 2 | 07040012 | 0.468615 | 0.000741005 | 206.113 | 07040011 | 0.00000 | 0.469356 | 195.922 |
| 3 | 07040016 | 0.467530 | 0.00182599 | 203.676 | 07040015 | -0.000602140 | 0.469958 | 193.778 |